Tomorrow afternoon in Arlington, Spain will play France for a place in a World Cup final. Spain has conceded one goal in five matches. Across the last two major tournaments for which complete event data exists, Spain’s champion side generated more shots per possession than any of the fifty-six teams measured. The easy explanation is talent. Spain simply has better players, and better players win.
This paper is about why the easy explanation is backward, what the data actually shows about how goals are constructed, and why the answer matters more for a ten-year-old in Texas than it does for anyone taking the field tomorrow.
#### A possession is a walk through rooms
Strip away the noise of a football match and every possession is a walk through the same few rooms. The ball starts somewhere, usually deep. We’ll call that room Build. To score, the team must move it through midfield, the room called Progress, and into the final third, the room called Create, and from Create it must produce a shot. At any moment the walk can end instead: the ball is lost in the team’s own half, lost in the opponent’s half, or put out of play.
Every team in the world walks these rooms. What separates them is the probability of each doorway. What is the chance this team, under this pressure, moves the ball from Build into Progress? From Progress into Create? From Create into a shot? A team’s style is nothing more than its set of doorway probabilities, and its output is nothing more than what those probabilities compound to.
This is not a metaphor. It is a measurable structure that can be fitted to real matches.
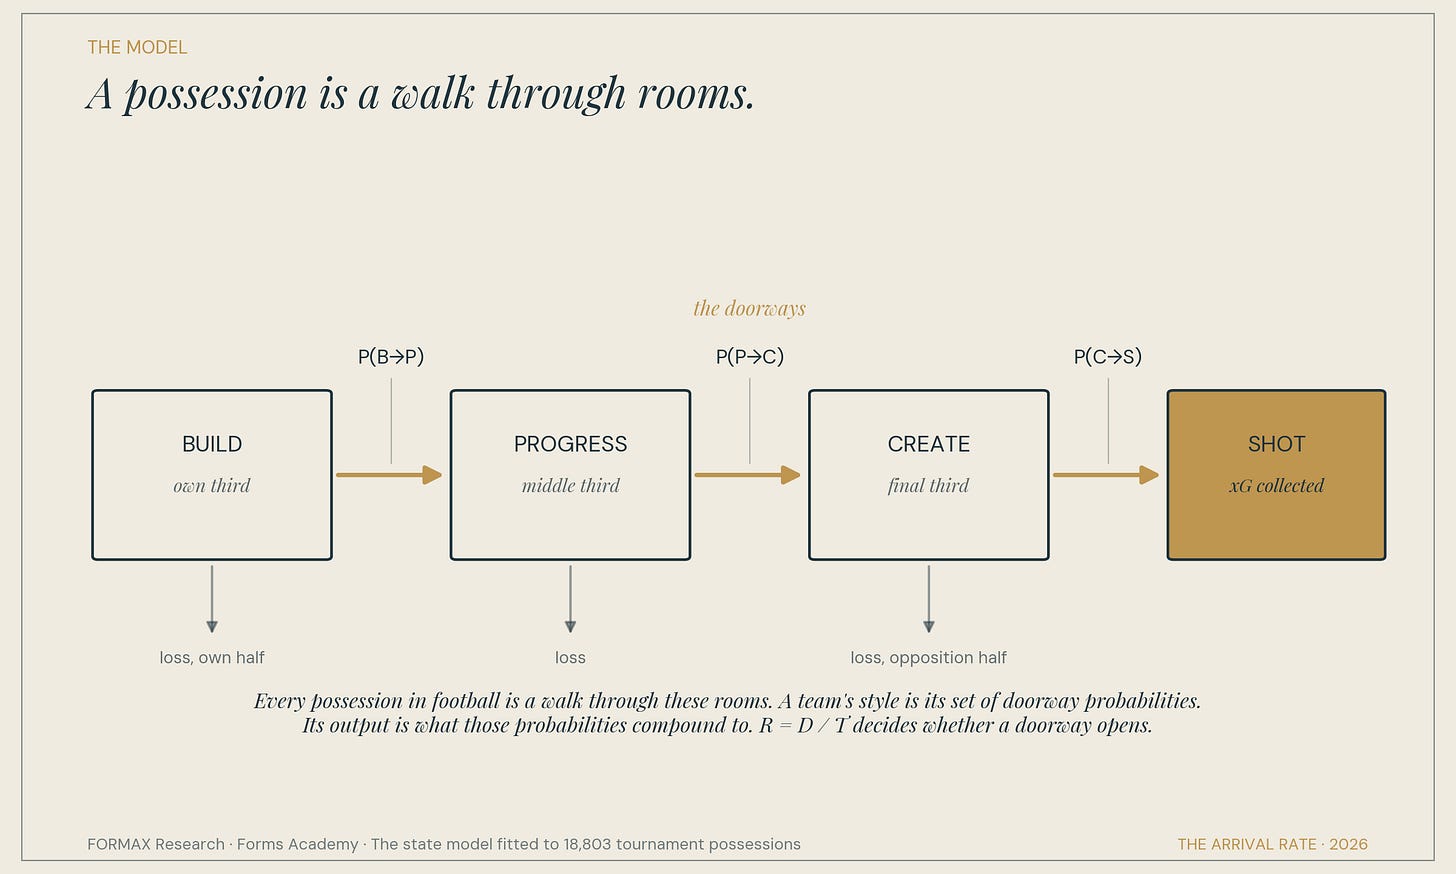
#### The state model. Four rooms, three forward doorways, three exits. Fitted to 18,803 tournament possessions.
#### The data
I fitted it using StatsBomb’s public event data and processed every match of the 2022 World Cup and Euro 2024: 115 matches, 18,803 possessions, 2,525 shots, every on-ball event located on the pitch. Each possession was mapped to the room structure above, each doorway probability was estimated for each of the fifty-six team-tournaments, and each shot was tagged with the room the possession occupied when the shot was taken, along with its expected-goals value. The full method, definitions, and limitations are in the appendix. There are three findings that matter, discussed below.
#### Finding one: a shot is not a shot
Where a shot comes from decides what it is worth. Shots taken while the possession had established itself in Create carried an average expected-goals value of 0.117 and converted at 11.8 percent. Shots launched from Progress, the long-range attempt, the hopeful strike before the final third was ever secured, carried an average value of 0.064 and converted at 2.0 percent.
Read that again. A shot from a constructed final-third possession is worth nearly twice as much as a shot from midfield and scores at almost six times the rate. On a stat sheet both count as one shot. On a highlight reel both look like attacking intent. They are not the same event. One is the end of a built structure. The other is a lottery ticket.
This is the first thing the eye test cannot see, and it will not be the last.
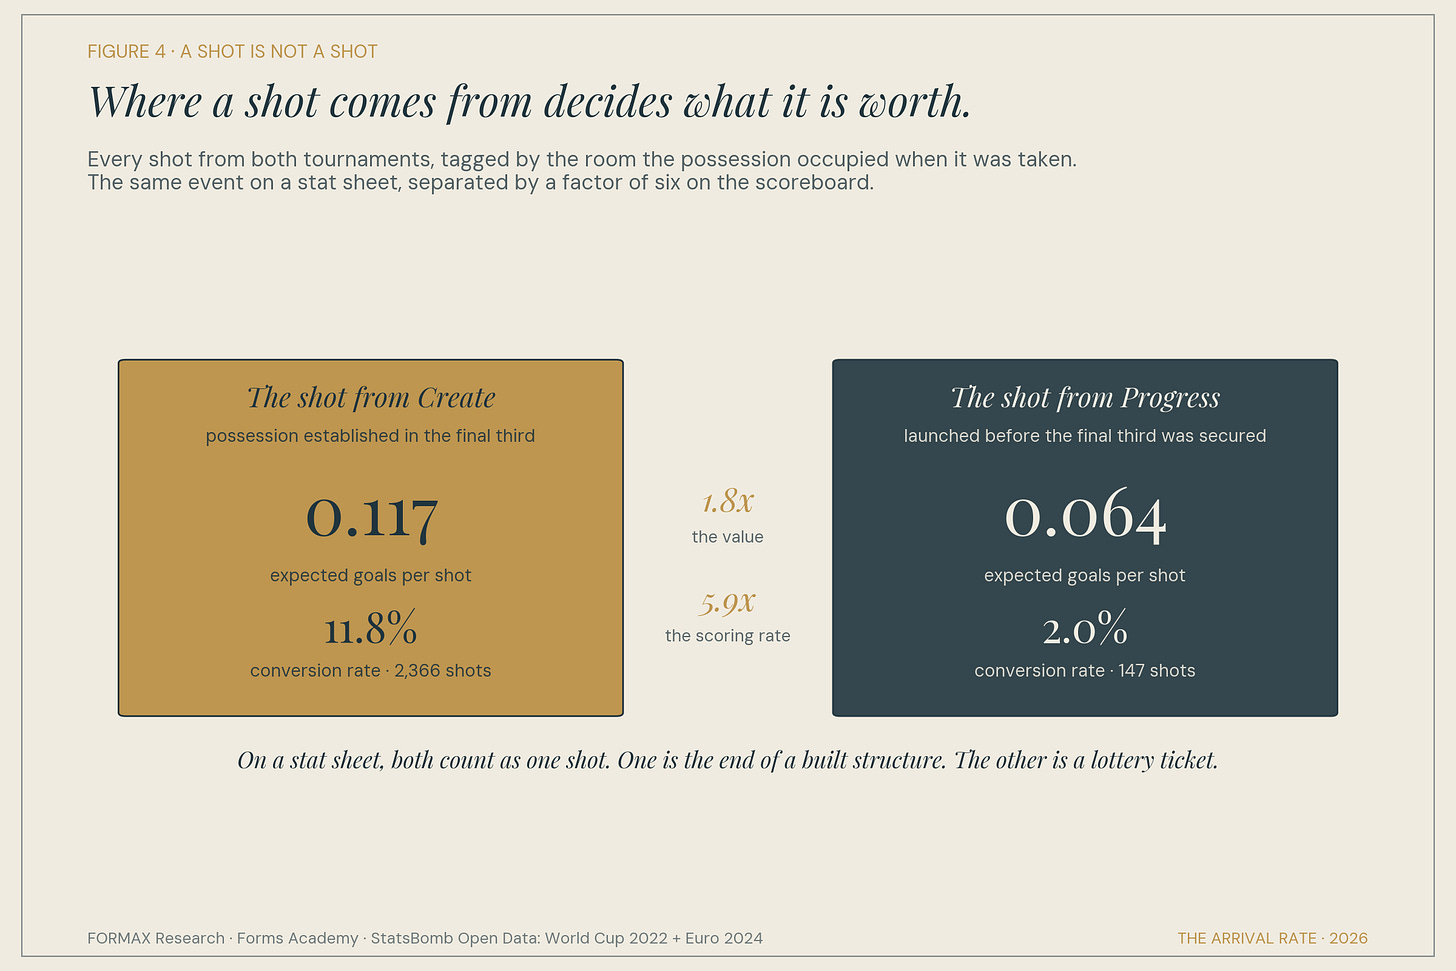
#### Every shot from both tournaments, tagged by the room the possession occupied when it was taken.
#### Finding two: the doorways predict the output
For each of the fifty-six team-tournaments, I computed a chain index: the product of the three forward doorway probabilities, Build to Progress, Progress to Create, Create to Shot. It is a single number answering a single question. When this team tries to walk the rooms, how often does the walk survive?
The chain index correlates with expected goals per possession at r = 0.705. The strongest single doorway is entry into the final third: teams that convert midfield possession into final-third possession score more per possession, at r = 0.636, and the relationship holds across both tournaments. The teams at the top of the index are the ones you would guess: Portugal, France, Germany, Brazil, Argentina, Spain. The teams at the bottom are the ones who spent their tournaments launching the ball and chasing it.
An honest reader should raise the obvious objection here, so I will raise it first. Correlation is not causation, and good teams are good at many things at once. This finding alone does not prove the chain causes the output. What it proves is narrower and still important: at the highest level of the sport, the teams that produce are the teams that can execute the forward transitions, without exception in this dataset. There is no team in these 115 matches that scored heavily while failing to move the ball through the rooms.
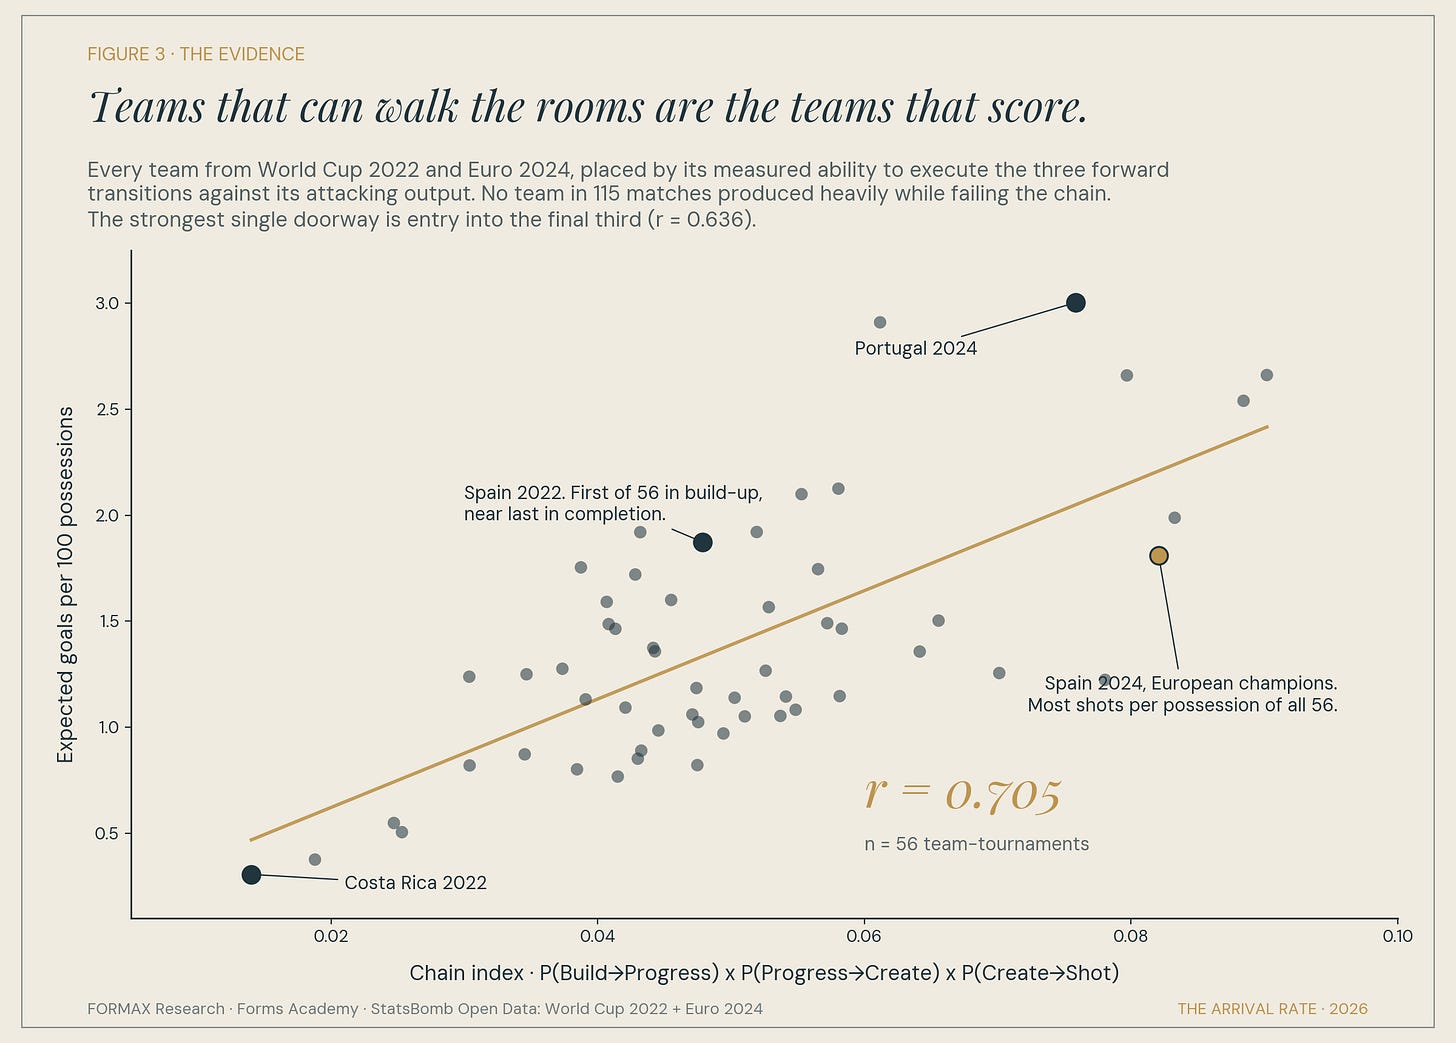
#### Fifty-six team-tournaments. Chain execution against attacking output, r = 0.705.
#### Finding three: the gap is not quality. It is arrival.
This is the finding that corrected my own model, and it is the one that explains why so many people misread youth football. I was certain construction would outperform, and it does, by a factor of two. What the model had wrong was the composition of the gap. The simulator’s working assumption, written into its own notes, was that direct football produces worse chances as well as fewer of them. The data disagrees on the first count.
Take the quartile of teams most committed to the constructed chain and the quartile least committed to it, the sides that skipped the rooms and went direct. Compare their output.
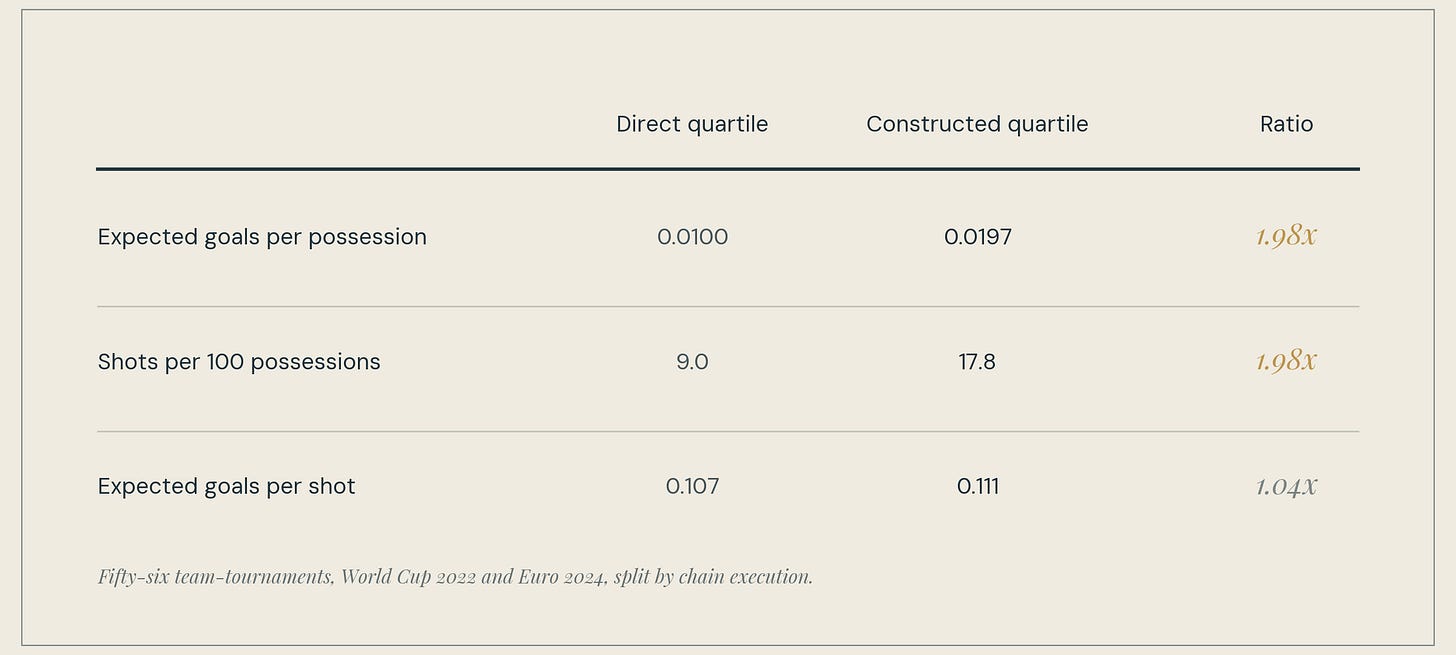 The constructed teams produced twice the expected goals per possession. But look at where the doubling lives. Their shots were not better. Expected goals per shot differed by four percent, a rounding error. Their shots were twice as frequent. The entire advantage, all of it, is arrival rate. Constructed football does not manufacture better chances than direct football. It manufactures the same chance twice as often.
This sits comfortably beside the first finding, and the reconciliation is worth stating because a careful reader will look for it. Shots from Create are worth more than shots from Progress for every team on earth. Direct teams average the same value per shot as constructed teams because when a direct team’s launch finally succeeds, the shot it produces is an ordinary Create shot, taken from the same places as everyone else’s. The launch does not degrade the chance; it fails to produce one. The price of directness is paid entirely in arrivals that never happen, which is exactly why the price is invisible while you are watching and undeniable when you count.
This is why the eye test fails, and why it fails specifically for parents. When a direct team finally arrives, its chance looks identical to the constructed team’s chance. Same penalty box, same shot, same roar from the sideline. A parent watching one Saturday morning sees no difference in quality because there is no difference in quality. The difference is a rate, and rates are invisible in single moments. They are only visible in accumulation, over a season, over a development cycle, over a career. The scoreboard on any given Saturday is a coin flip drawn from those rates. The rates themselves are the truth.
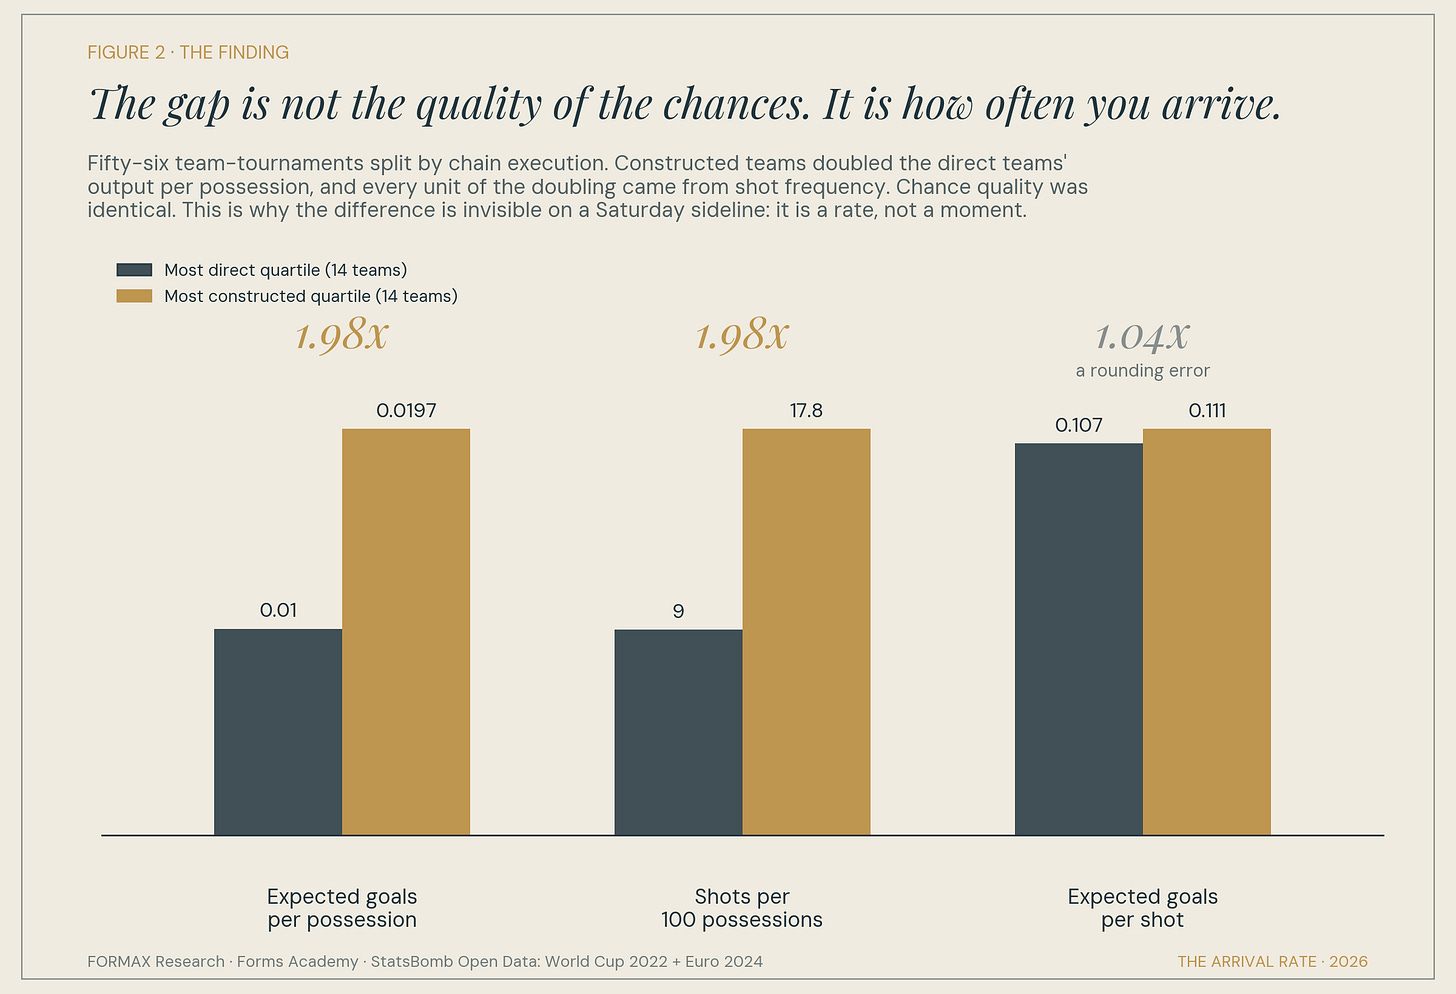
#### The doubling lives entirely in shot frequency. Chance quality is a rounding error.
One more bit of honesty. Direct football at this level is not incompetence. The Netherlands played the 2022 World Cup in the direct quartile and reached a quarterfinal, because a direct chain executed by elite professionals is a legitimate competitive weapon. The distinction that matters is not direct versus constructed as a moral question. It is that the direct chain’s output is capped near where you see it in that table, while the constructed chain’s output scales with the technical capacity of the players executing it. One style has a ceiling built into its structure. The other has a ceiling built into its players. That distinction is the entire subject of this paper.
#### Spain, in two acts
The dataset contains a controlled experiment, and it’s Spain. In 2022, Spain led all fifty-six team-tournaments in the first doorway. Their probability of moving the ball from Build into Progress was 0.861, the highest measured, comfortably clear of every rival. And their final doorway, Create into Shot, sat at 0.112, near the bottom of the entire dataset. Spain climbed the first rung of the ladder better than anyone alive and stalled on the last one. They passed Morocco into exhaustion for a hundred and twenty minutes in the round of sixteen, did not score, and went home on penalties. The football world called it the death of possession play.
But, of course it was not. It was the difference between possession and construction. Possession is occupying the rooms. Construction is walking through them to the end. In 2024, a rebuilt Spain executed the full chain: Build to Progress at 0.744, Progress to Create at 0.548, Create to Shot at 0.201, and the most shots per possession of any team in either tournament. They won the European Championship. Same federation, same philosophy, same talent pipeline, twenty-two months apart. What changed was not the commitment to the ball. What changed was completion, the willingness and capacity to convert the final third into shots rather than into more possession. The chain is only a chain if it reaches the end.
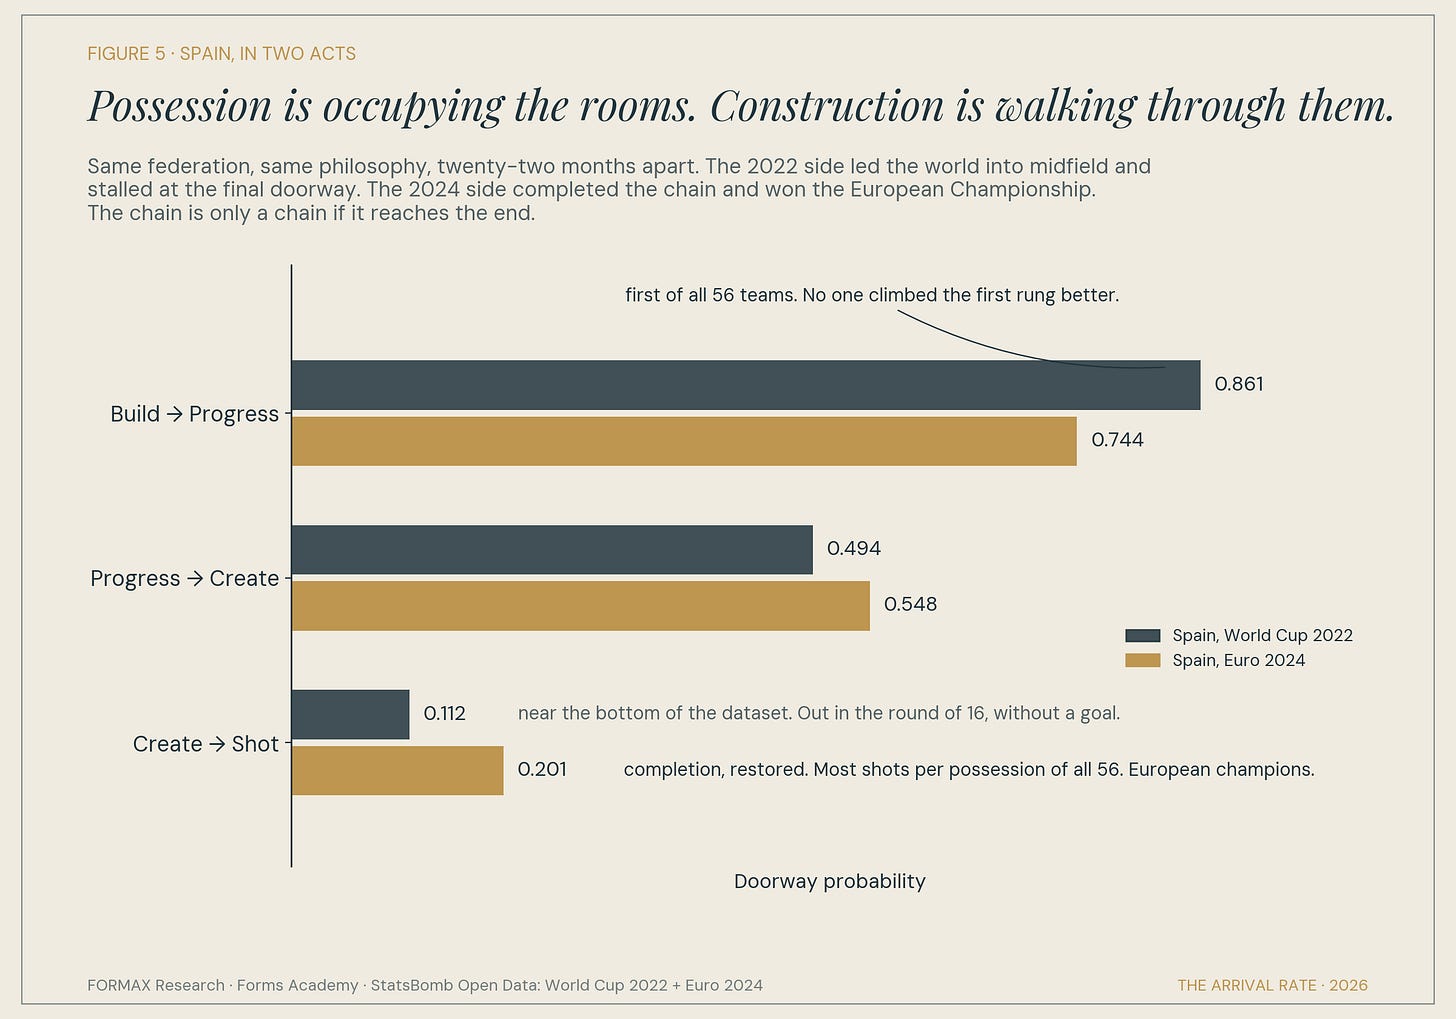
#### Same federation, same philosophy, twenty-two months apart.
That team is the one playing in Arlington tomorrow, having conceded once in five matches, needing late goals in consecutive knockout rounds and getting them, because a chain that arrives seventeen, twenty, twenty-one times per hundred possessions eventually collects. Belgium survived on 0.37 expected goals against them in the quarterfinal until the eighty-eighth minute. The arrival rate does not care how long you survive. It compounds.
#### The mechanism: why chains collapse and why ceilings rise
The findings above describe elite teams. To understand development, you need the mechanism underneath, and the mechanism is a fraction.
Every forward transition carries an intrinsic difficulty: the pressure, the space, the speed of decision it demands; we’ll call it D. Every player, and every team, brings a technical capacity to that transition: the trained, automated ability to execute it under those conditions. Call it T. The perceived risk of attempting the transition is R = D / T. When capacity comfortably exceeds difficulty, R falls below one, and the player attempts the action freely. When difficulty exceeds capacity, R rises above one, and something predictable happens: the player stops attempting. He recycles the ball sideways, or launches it, or loses it trying. The doorway closes not because the tactic is wrong, but because the substrate cannot afford it.
I built an interactive simulator around this mechanism, now calibrated against the fitted tournament values above, and it demonstrates the structural point cleanly. It is public at Forms Markov Simulator, and every claim in this section can be tested by moving its sliders. A constructed chain run by players with high technical capacity produces roughly three times the output of kick-and-rush football and twice the output of counterattacking football. The same constructed chain, run by players with low technical capacity, produces less than a kick-and-rush. Both results are correct. A team asked to play associative football without the substrate to execute it is playing the wrong chain, and it will look worse than a team that honestly committed to launching the ball.
But here is the asymmetry that decides everything. The direct chains are flat. Kick-and-rush produces roughly the same output no matter how much technical work is invested in the players, because the style is designed not to require technique. The constructed chain is the only one whose ceiling rises with investment. Every hour spent building technical capacity increases output, and raises nothing for alternatives. Choosing a style is choosing which curve your players live on: one that responds to their development, or one that ignores it.
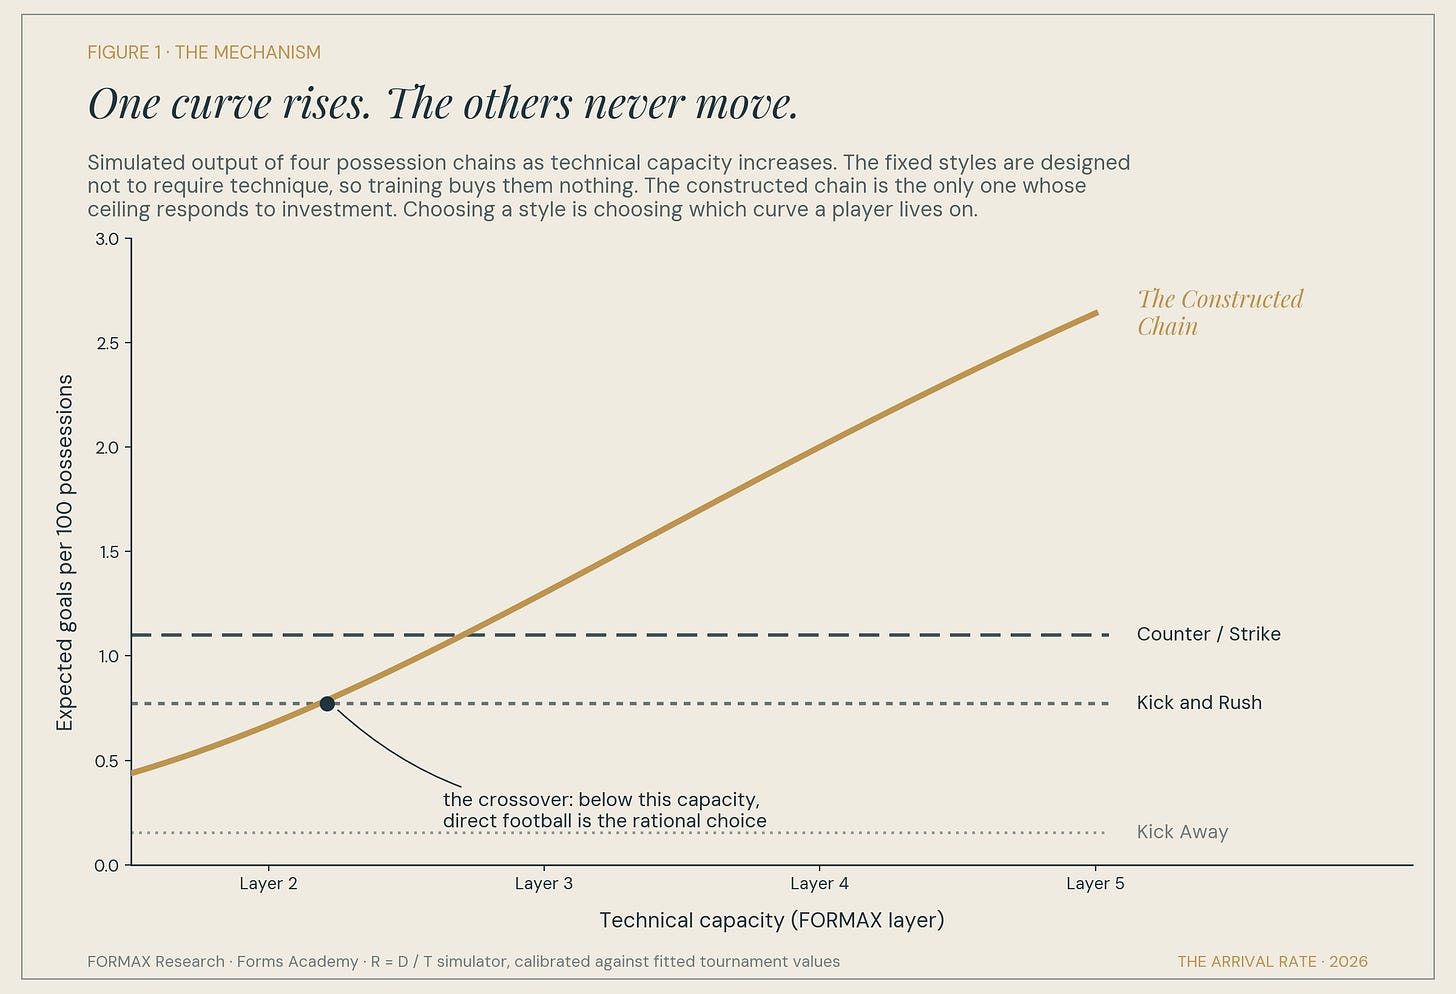
#### Simulated output of four possession chains as technical capacity rises, calibrated against the fitted tournament values.
#### The youth translation
Everything above concerns adults. The reason it matters for children is that American youth soccer has organized itself, structurally and financially, around the flat curve.
Consider what the incentives reward. Clubs are ranked by league standings. Coaches are retained by results. Parents choose clubs by wins and trophies. And at ages ten through fourteen, the fastest route to results is not technical development. It is selecting the biggest, earliest-maturing children and playing direct: the chain that requires no substrate, produces its nine arrivals per hundred possessions immediately, and beats the technical team down the road whose chain is still under construction and whose R values still sit above one. The direct team wins on Saturday, the scoreboard confirms the method, the parents stay. The model sustains itself.
The research record on what this purchases is not ambiguous. Match results at youth ages are poor predictors of who becomes a professional; the German federation’s own longitudinal diagnostics, tracking tens of thousands of players through its talent program, found that technical skill measures in childhood, ball control, dribbling speed, predict later progression to the professional level far better than winning does. Practice-history studies of professionals and dropouts, the line of work associated with Ford and Williams in England, found the players who reached the top had accumulated substantially more time in ball-contact, skill-building activity through childhood, not more competitive match volume. And the two most instructive national case studies of the modern era, Germany’s deliberate post-2000 rebuild after its European Championship humiliation and Belgium’s technical overhaul in the same period, both chose substrate over results at youth level and both collected at senior level a decade later. Spain itself is the oldest version of the story. The Spain that lost to Belgium in 1986 was La Furia, direct and physical and perennially short. The Spain playing tomorrow is what happened after a nation rewrote its curriculum around the ball.
The American structure does the reverse. It converts the ages when the technical window is widest, when the nervous system is most plastic and R = D / T is most trainable, into a results market. It selects for birthdate and body mass, the relative age effect running through every elite American roster. It rewards the coach who closes the doorways and punishes the one who builds them. And the bill arrives at seventeen, when the early maturers’ physical edge evaporates, the substrate that was never built cannot be retrofitted, and the direct chain’s flat ceiling becomes the player’s flat ceiling. On July 6, a fully professionalized American national team lost 4-1 in Seattle to Belgium, a country with a fraction of its player pool, and the gap on display was not athleticism, funding, or desire. It was doorways.
#### The part every parent should hear before they need it
If your child trains in a substrate-first environment, a team built around technical capacity before tactical structure, that team will lose matches at eleven and twelve to direct teams. Sometimes badly. This is not a flaw in the method revealing itself. It is the method’s math, stated in this paper openly: a constructed chain at low technical capacity underperforms kick-and-rush, and every eleven-year-old on earth is at low technical capacity, because capacity is precisely what is still being built. The direct team has borrowed its results from a flat future. The constructed team is investing in a rising one. Think about this in finance terms: the scoreboard at eleven measures the loan, not the investment.
The trap is treating the temporary state as a verdict. That verdict, delivered by a parent in the car on the way home, or by a family switching to the club that wins, is the single decision that converts a developing player onto the flat curve, usually forever. It is also the decision the entire American system is engineered to produce.
#### What the alternative looks like
A substrate-first curriculum is not an abstraction. Ours is called FORMAX, and it has been tested on American children in Texas for thirteen years, so what follows is not a theory of what might work but a description of what is running. Technical capacity is developed across five measured domains: coordination and body control, kinesthetic feeling for the ball, accuracy and speed of execution, range of mastered technical elements, and functional application, the last being the one Spain relearned between 2022 and 2024, the conversion of capacity into completed chains. Players progress through five layers, from foundational precision to expressive synthesis, and the layer scores are the T in every player’s R = D / T. Tactical understanding is sequenced rather than rushed: game intelligence grows through the ball from the first session, but imposed positional systems wait until roughly twelve, when the substrate can pay for them, because a tactic a player cannot yet execute is a chain he cannot walk. And passing is earned at seven rather than assigned, because a pass a child cannot yet weight is a doorway that will close under pressure for years.
A distinction is worth making carefully here, because it is the honest one. Construction is not proprietary and never was. Spain plays it on television in front of the world; the chain, the doorways, the arrival rate are public knowledge, and any American club, school district, or state association could choose the destination tomorrow. The DFB chose it nationally. Belgium chose it. What is proprietary is the road: the production of the functionally technical player, the sequencing of five domains through five layers, the thousand decisions about what a seven-year-old earns and when. That is thirteen years of engineering, and it belongs to Forms the way La Masia’s curriculum belongs to Barcelona. The invitation of this paper is not to copy anyone’s road. It is to stop pretending the destination does not exist.
#### Arrival
Tomorrow in Arlington, one of the two best chains in the world will walk its rooms against the other, and whatever the scoreboard says, the deeper result was decided years ago, in training halls in Madrid and Clairefontaine, in the doorway probabilities two federations spent a generation building. That is what a World Cup semifinal is: the arrival rate, matured.
Every ten-year-old in America is currently being placed on one of two curves. One is flat, produces its nine arrivals per hundred immediately, wins on Saturday, and never moves again. The other starts lower, rises with every trained hour, and has no ceiling anyone has yet found. The data in this paper says the gap between them at the top of the sport is a doubling, that the doubling is made entirely of arrivals, and that arrival is a skill, built in childhood, doorway by doorway.
The direct team is already at its destination. The constructed player is still traveling. The only question that matters in youth development is which one you are raising.
#### Appendix: Data and Method
Source. StatsBomb Open Data, publicly released event data: all 64 matches of the 2022 FIFA World Cup and all 51 matches of UEFA Euro 2024. 115 matches, 18,803 possessions, 2,525 shots, 56 team-tournaments (32 World Cup, 24 Euro).
State definitions. StatsBomb records event locations on a 120 x 80 pitch with the acting team attacking toward x = 120. Each on-ball event (pass, carry, dribble, shot, goalkeeper distribution) by the possession team was assigned a room by ball position: Build (x < 40), Progress (40 to 80), Create (x ≥ 80). Possessions beginning with a goal kick or kickoff were assigned an initial Restart state. Consecutive events in the same room were collapsed into a single state visit; transitions were counted between distinct state visits.
Absorptions. A possession ending in a shot was absorbed at Shot, with the shot’s origin defined as the room the chain occupied when the shot was taken and its value taken from StatsBomb’s expected-goals model. Possessions ending in a shot were terminated at the first shot. A possession ending with the ball out of play or offside was absorbed as Dead. All other endings were classified as losses, own-half (final ball position x < 60) or opposition-half (x ≥ 60).
Team measures. For each team-tournament: forward doorway probabilities P(Build→Progress), P(Progress→Create), P(Create→Shot), each estimated as the transition’s share of all departures from its source room; shots per 100 possessions; expected goals per possession; expected goals per shot; and the chain index, the product of the three forward probabilities. Quartiles were formed on the chain index (n = 14 per quartile).
Key fitted values. Expected goals per shot by origin room: Create 0.117 (n = 2,366 shots, 11.8 percent conversion), Progress 0.064 (n = 147, 2.0 percent), Build 0.068 (n = 12, indicative only). Chain index versus expected goals per possession: Pearson r = 0.705 (n = 56). P(Progress→Create) versus expected goals per possession: r = 0.636. Top versus bottom chain-index quartile: expected goals per possession 0.0197 versus 0.0100 (1.98x), shots per 100 possessions 17.8 versus 9.0 (1.98x), expected goals per shot 0.111 versus 0.107 (1.04x). Spain, Euro 2024: P(B→P) 0.744, P(P→C) 0.548, P(C→S) 0.201, 21.0 shots per 100 possessions, first of 56. Spain, World Cup 2022: P(B→P) 0.861, first of 56; P(C→S) 0.112; 13.0 shots per 100 possessions.
Limitations. These are observational correlations from elite tournament play; they establish that chain execution and output move together at the top of the sport, not that one causes the other, and the developmental claims in this paper rest on the cited longitudinal and practice-history research, not on this dataset alone. The room structure is deliberately coarse: three zones by pitch length, first shot terminates the possession, and set-piece situations beyond goal kicks and kickoffs are not separately modeled. Expected-goals values depend on StatsBomb’s model. Teams in the direct quartile at a World Cup remain elite professionals; the gap measured here should be read as a floor on the difference between the two curves, not its full extent at developmental levels.
Referenced research. DFB talent program motor diagnostics and longitudinal prognostic studies (Höner and colleagues, University of Tübingen, multiple publications 2015 to 2021) on the predictive validity of childhood technical measures for adult professional attainment. Practice-history studies of elite versus non-elite English players (Ford, Ward, Hodges and Williams, and subsequent work) on childhood ball-contact volume. Federation reform histories: the DFB Extended Talent Promotion Programme and academy licensing reforms initiated after Euro 2000; the Belgian FA technical plan of the same period. Match data for World Cup 2026 references from published Opta figures.
Reproducibility. The full fitting pipeline, fitted transition matrices, and parameter file are available from Forms Academy on request. The interactive simulator implementing the R = D / T mechanism, calibrated against the values above, is public at https://forms-markov.netlify.app/simulator/.
FORMAX Research · Forms Academy · July 2026