FORMAX Research, Item No. 02, Part 1. Companion to The Arrival Rate.
On 22 November 2022 in Doha, Argentina’s 2-1 loss to Saudi Arabia was widely regarded as one of the most significant upsets in World Cup history, with global media calling it a disaster.
An alternative analysis of that match reveals a different narrative. Argentina entered the Saudi penalty area 16 times in open play, compared to Saudi Arabia’s six entries. Of Argentina’s 16 entries, 12 resulted from mechanisms that were routinely employed throughout the match: the same origins, channels, and build patterns were consistently repeated. In contrast, Saudi Arabia managed only two such entries.
*
- A review of Fig. 01 demonstrates that one side consistently manufactured the same attacking pattern on demand, while the other created fewer opportunities yet scored twice. Twenty-four days later, the team that exhibited this repeatable ability won the World Cup, employing the same mechanisms used in Doha.That capability remained unchanged during the 24 days between the two results. This paper aims to shift the perspective on goals and the evidential weight attributed to them. While a goal is the most valuable event in a match, it is also the most overvalued form of evidence in the sport. A goal indicates that an attacking sequence, from collective thought to execution, was completed once. However, it does not reveal who designed the attack, how it was constructed, or whether it can be reproduced.This misconception significantly affects the economics of the sport. Because goals ultimately determine match outcomes, the market tends to reward the player who delivers the final touch. The finisher accrues the value generated by the underlying mechanism. However, it is the mechanism that can enhance a finisher’s value, just as its absence can diminish the perceived value of even a highly skilled striker.For example, an average striker supported by Spain’s attacking structure may score more frequently than a highly skilled finisher who must rely on inferior opportunities within a weaker system.Many of the points briefly introduced here will be addressed in a separate paper. Returning to the present topic, this paper examines the gap between the two previously mentioned ledgers and explores why this distinction is particularly significant in the context of children’s football, an area frequently overlooked by analytics.In summary, a goal records the outcome of a single attack. The quality of an attack is determined by whether the underlying system can reproduce it. A goal resulting from a fractured or disjointed play provides no insight into the types of attacks that may be available in the future. An attack generated by a mechanism that can be executed repeatedly holds value, regardless of whether any single instance results in a goal, because it will create future opportunities. Therefore, reproducibility serves as a measure of the effectiveness of the system producing attacks. The scoreline is a downstream, unreliable indicator that reflects only the number of successful conversions and does not indicate the potential for future success. The central empirical finding of this paper is that a team’s attacking identity is sufficiently stable to be measured, can be contested by opponents in each match, and is predictive of future attacks in proportion to the extent that its attacks are self-generated.Stated differently, teams possess an attacking identity, and this identity adheres to three principles:It is real: teams reuse their own routes far beyond what chance would predict, so identity can be quantified rather than merely described.
- It is contested: every opponent gradually diminishes that identity over time and across matches, but no opponent ever completely erases it.
- It is owned: only the attacks a team constructs itself are likely to recur in the future, while attacks resulting from an opponent’s mistakes may be considered temporary and will not recur unless the opponent repeatedly commits the same errors.
Real, contested, and owned. Now consider goals themselves. When evaluated in isolation, goals fail all three tests because a goal records the outcome of a single attack, whereas recurrence* measures whether the underlying system can reproduce that outcome.
What counts as an attack, and what counts as the same attack
The dataset used for this paper is StatsBomb’s event data covering 262 matches from five senior international tournaments: the 2018 and 2022 World Cups, Euro 2020 and 2024, and Copa América 2024, producing 7,923 open-play possessions that reached the penalty area.
An attack, for the purposes of this paper, is an open-play possession that reaches the penalty area through a completed pass, a carry, or a shot. I will not be including corners and penalties as they are set aside as a separate question since they are not open-play. Typically, teams produce about 15 such direct attacks per match, which is the subject of a separate study and analysis. If interested in that paper, let me know in the comments.
At the highest level of the sport, only one in 12 attacks produces a goal, which produces a conversion rate of 8.4%, which is why you will hear me describe football as a game of failure when speaking to youth players. This is an important point for parents to understand - failure is the normal outcome of an attack, even when it is well constructed with, by, and against the players of whom are amongst the best in the world.
I define the machine as the factory that generates a team’s portfolio of mechanisms, and a mechanism as the pattern behind one attack, the where and the how of its construction rather than the result it produced. Every attack is classified on three coarse coordinates:
- The third of the pitch where the possession began.
- The channel through which it entered the box, meaning the lateral lane of the pitch at the moment of entry, split into five the way positional play splits it: left wing, left half-space, center, right half-space, right wing, with the boundaries taken from the real pitch markings, the penalty-area edge and the six-yard-box edge, rather than drawn arbitrarily.
- The length of the build, measured as zero to three passes, four to nine, or ten and above, with counterattacks flagged separately.
No clustering algorithm, nothing a coach or suppoting staff could not record from the touchline with pen and paper.
One naming rule for the rest of the paper. A mechanism is the pattern. A mechanism class is the same pattern treated as a bin for counting: sixty bins are possible (three origins x five lanes x four build lengths) and every attack falls into exactly one bin. When the prose says route, it is a plain word for the same thing; it never means the exact path the ball traveled.
An attack recurs when the same team produces another attack from the same mechanism class in the same match. Argentina’s 12 in Doha were recurrences. The recurrence rate is the count of those repeated entries per match. That choice needs defending, because repetition can be counted two ways, as a proportion or as a volume, and only one of them is stable enough to mean anything.
The first is the proportion, which is repeated entries divided by all entries. Across the sample, it averages 0.46, and Spain at Euro 2024 reached 0.55 against a field of 0.44. The second is the volume, repeated entries per match. Because the volume multiplies the proportion by how often a team reaches the box, it reflects two things at once: how much a team repeats and how much it attacks.
This paper uses the volume, and we find the reason in the numbers. To understand whether a measure is reporting something real about a team or merely capturing noise, we must check whether it remains consistent. Two ways to check: within a match, compare a team’s first half against its second, and across matches, see whether one match predicts the next. The results are correlations, where zero is no relationship, and one is a perfect one; so it is important to read the 0.44 and 0.55 across this correlation measured range and not as percentages.
The proportion holds at 0.07 within a match and 0.09 from one match to the next. Both are close to zero, which means the proportion is mostly noise. The volume holds at 0.22 and 0.25. These are small numbers, and they should be as football is decided by a handful of events per match. Randomness runs through every measurement, and no honest measure posts large correlations here. The fair comparison is not against perfection but rather against the alternative: the volume’s stability (0.22) is roughly three times the proportion’s (0.07), and it clears both tests, within the match and across matches, where the proportion clears neither. One honest limit on the first test: teams change tactics at halftime, so the two halves are never identical, and that pulls down every half-to-half comparison, though not necessarily by the same amount. The volume still separates from the proportion, and still predicts across matches where even the opponent changes.
The Markov language I have used throughout this series offers a way to think about the distinction, provided it is borrowed carefully. In a Markov chain, a state is recurrent when the process returns to it with probability one, and transient when there is some chance it never returns. Those are strict conditions about infinite processes, and nothing inside a ninety-minute football match establishes them, much less a shorter youth match. Watching a mechanism appear four times does not demonstrate recurrence in the mathematical sense. What the analogy supplies is not a proof but a distinction worth looking for, as some attacks are generated from positions a team can return to under its own power, and others depend on situations that arrive by accident and cannot be summoned again, a deflection, or an isolated defensive error. A parent who says the opposition only score off our mistakes is naming that distinction exactly. This paper measures it and calls the result operational recurrence. The name concedes something deliberately as it claims only that a team returned to a mechanism repeatedly in the matches observed, not that it would return forever, which is what the mathematics asserts and what no football match can demonstrate.
Test one: what survives halftime
If goals measured attacking quality, a team’s first-half goals would generally resemble its second-half goals, since the players, the opponent and the match are the same. That is the cleanest available test of reproducibility; however, measuring by goals fails that test.
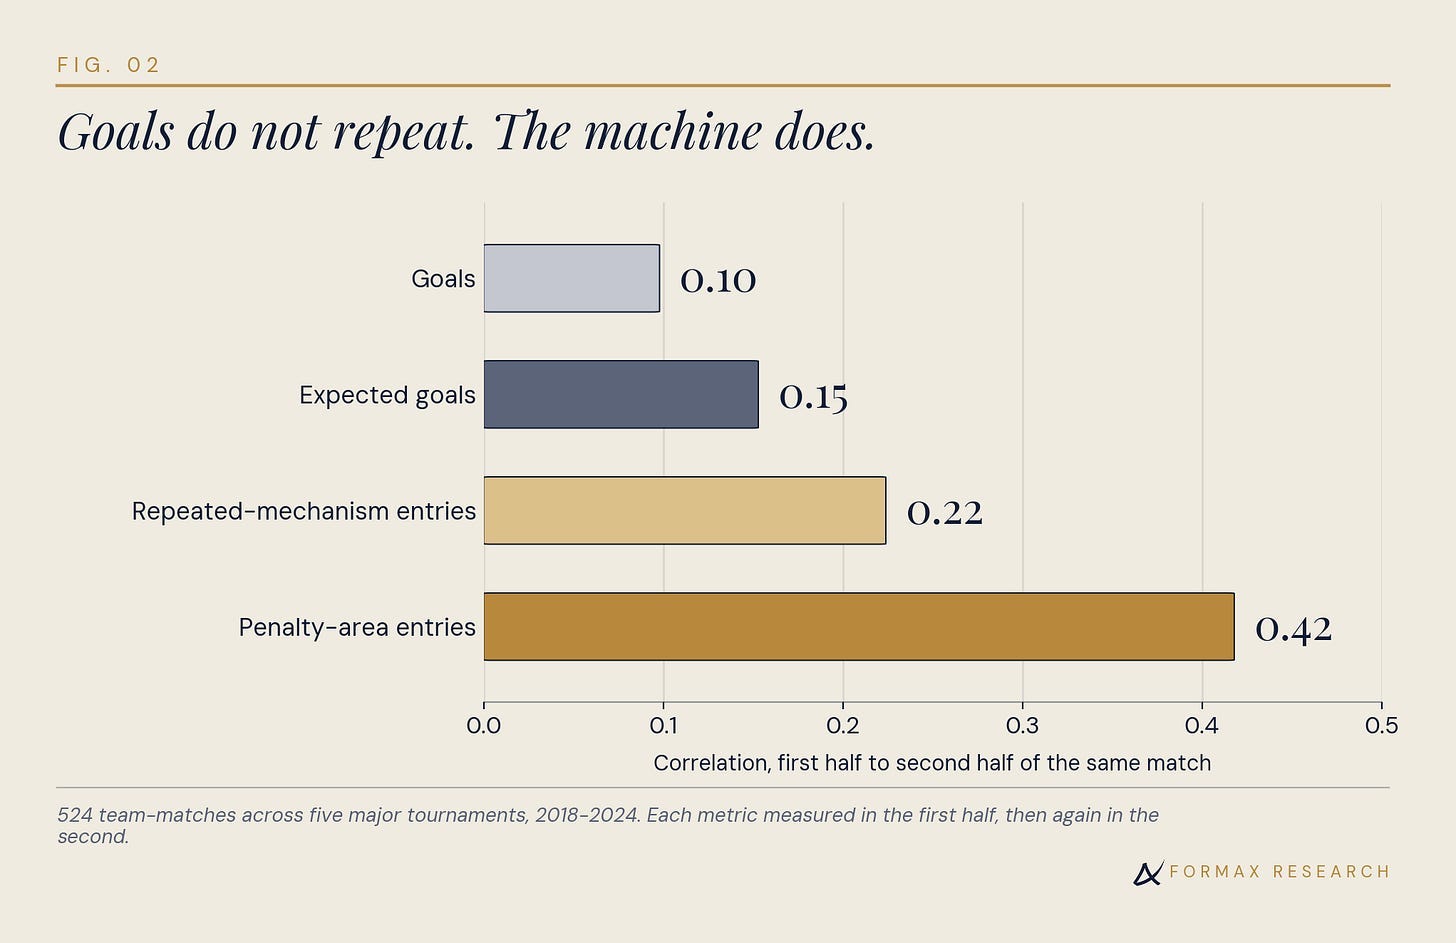 Across 524 team-matches, first-half goals correlate with second-half goals at 0.10, which, on a 0.0-1.0 range, is close to no relationship at all. Expected goals, introduced partly to solve this problem, reach 0.15. Repeated-mechanism entries reach 0.22, and total penalty-area production reaches 0.42, more than four times the stability of the goal count.
The measure that every parent, coach, and journalist relies on is the one that holds up worst on gameday because goals do not measure the machine. Rather, goals, as I’ll go on to make the case, are the most unreliable measure in the game, and ironically, the one we as parents care about the most.
Test two: how often the scoreboard misreports
If the machine and the scoreboard described the same thing, the side producing more repeated-mechanism entries would generally win. Across the 262 matches, 250 had a clear machine edge. The scoreboard agreed with that edge in 118 of them. In 61, the match was drawn, and the edge vanished from the record. In 71, the side with the weaker machine won outright.
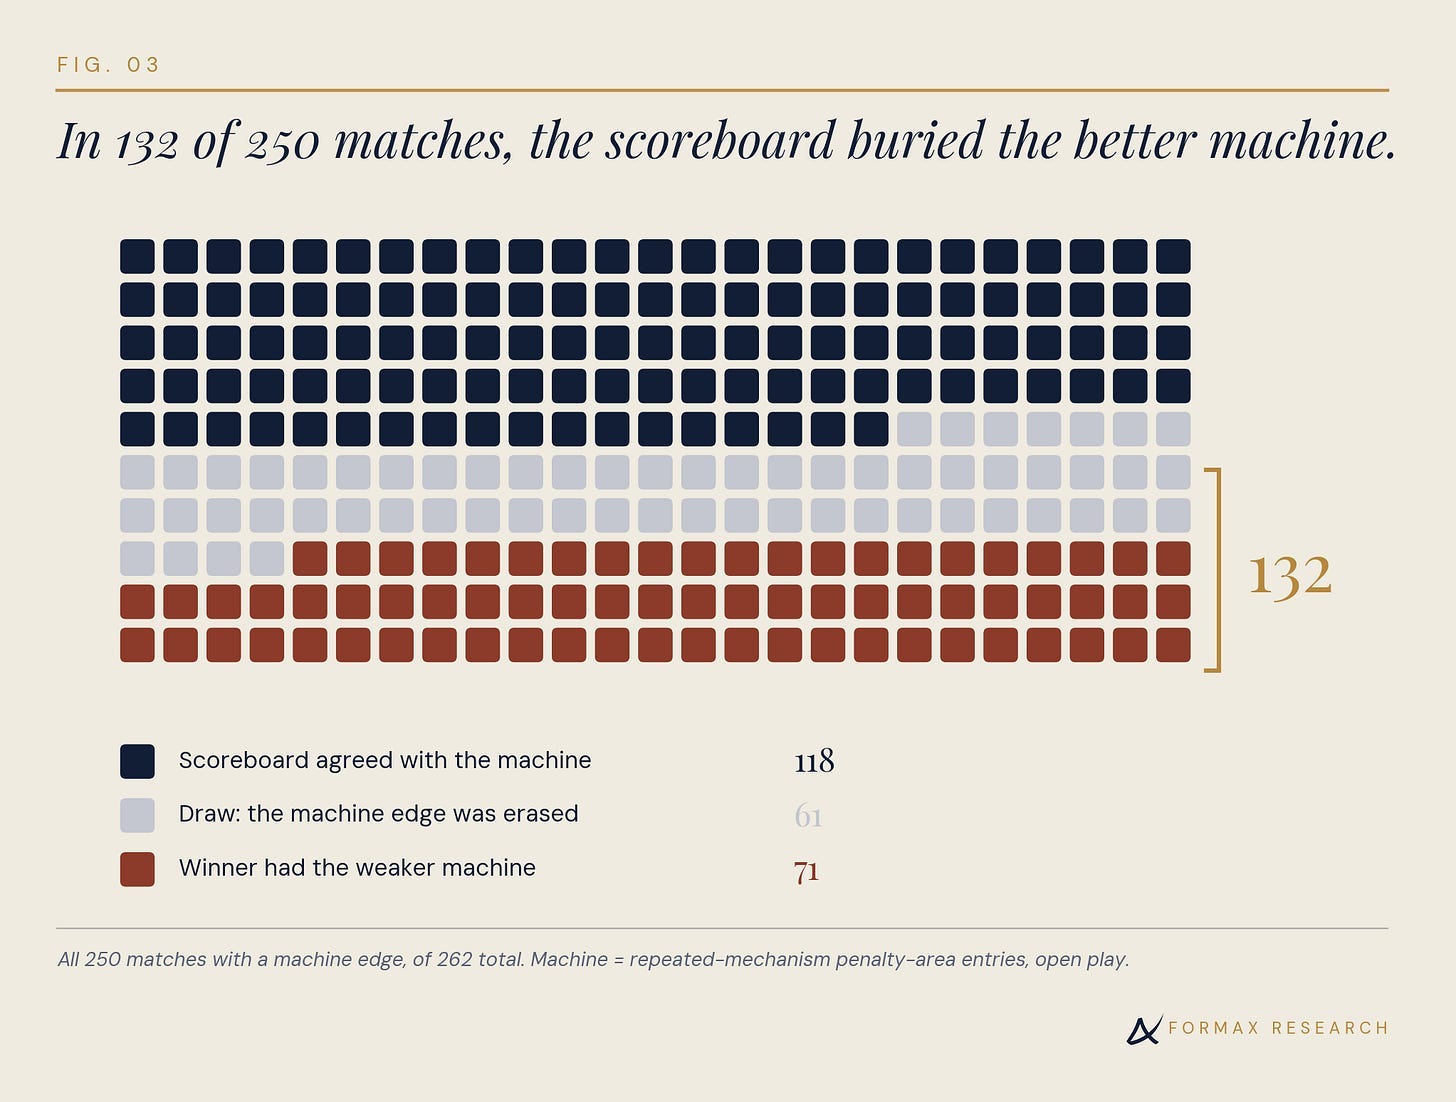 That leaves 53% of matches in which the final score either buried or reversed the verdict on which side was better at generating attacks. Among decided matches, the winner had the weaker machine 38% of the time. This is happening at the World Cup, with the best players in the sport, under the heaviest scrutiny the game produces. As much as a disaster as it may have seemed, Doha was not an anomaly; it was an ordinary consequence of how rarely football converts.
This is not an argument that results are random; in fact, it’s quite the opposite. The machine-stronger side wins approximately 62% of decided matches, and that figure increases the more matches you watch, meaning the better machine agrees with the result 59% of the time over a single match, 62% over three, and 63% over seven. The scoreboard is not wrong in the long run; it’s wrong in the short run, and a single match is the shortest sample there is. Over a tournament, much of the luck washes out, and the stronger machine tends to rise. The machine is simply the part of that outcome you can read in match one, before the averaging has had the opportunity to occur. Doha did not contradict Argentina’s quality; it simply took 24 days for the scoreline to catch up to it.
This is the whole argument for youth football compressed into one point. A child is always in the short run, and every weekend is match one, played over and over, and the averaging that rescues a World Cup team over a month-long tournament never gets the chance to happen, because nobody is keeping the ledger that would show what is actually happening. Results get recorded, but how often the team got into the box does not. A young player’s goals on any given weekend tell you very little, as they are one result on one match, shaped as much by chance and mismatched size, speed, and physicality as by anything the child did. What tells you something is whether the player is building the machine, the technique, the touch, the confidence, and the decision, all repeated until it can withstand the pressure. That is what growth should be measured on, and it is exactly what a scoreboard cannot see.
Test three: which ledger predicts next week
Stability inside a match is one question; however, the more important question for anyone selecting, promoting, or discarding a team is what the current match tells you about the next match.
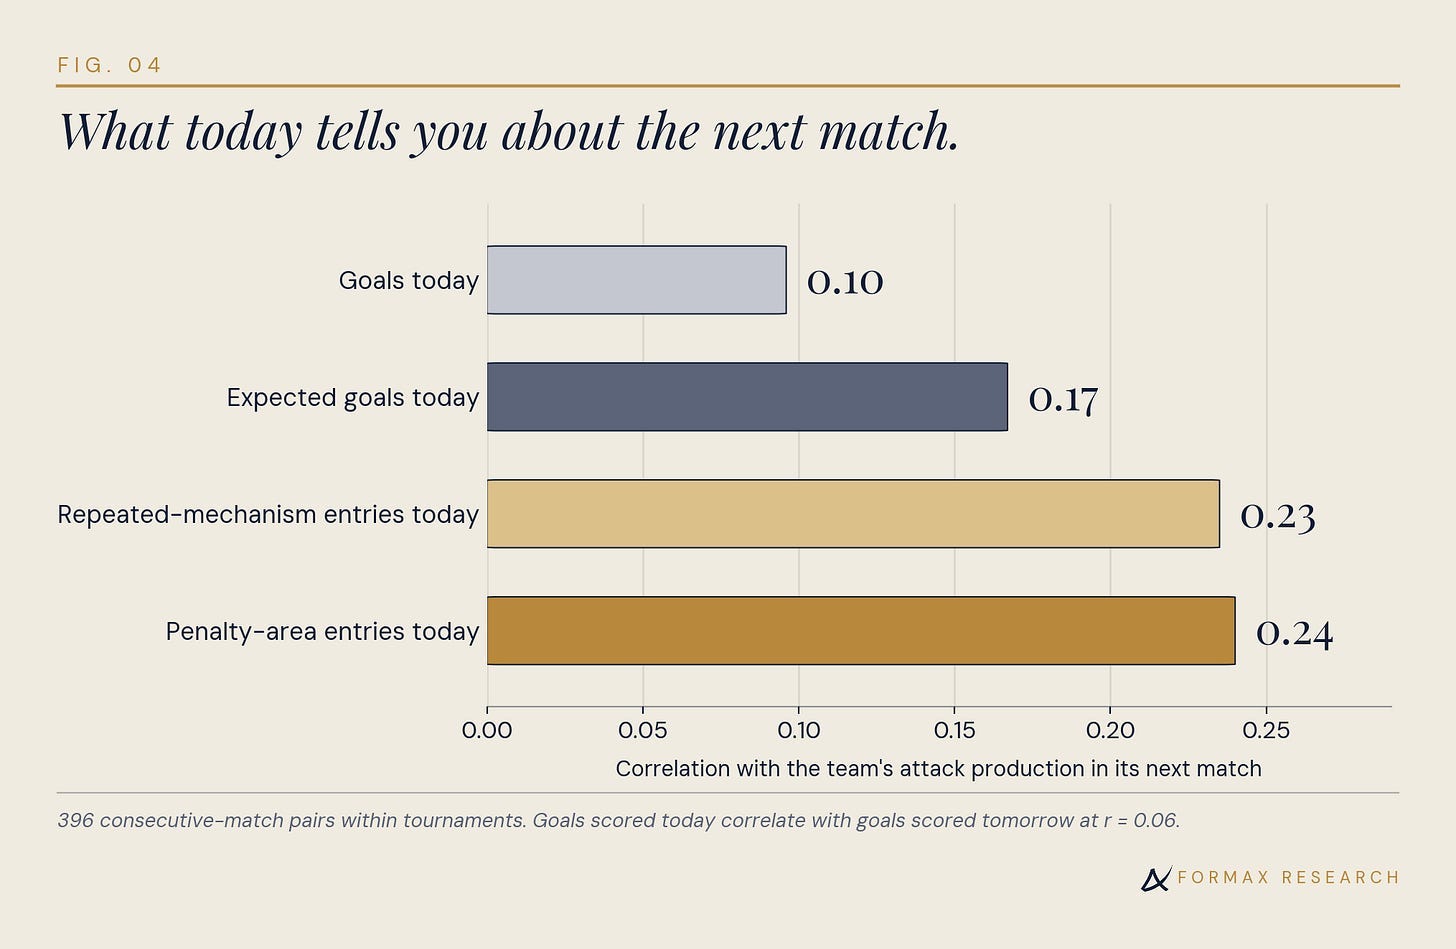 Across 396 consecutive-match pairs inside tournaments, goals scored today correlate with goals scored in the next match at 0.06, which is indistinguishable from no information at all. Attack production, on the other hand, predicts the next match’s attack production at 0.24, and repeated-mechanism entries at 0.235. These are modest numbers, everything measured in football is modest, which is exactly why the comparison matters: they carry four times the predictive content of the goal column drawn from the same ninety minutes.
I also ran the test in a form designed to defeat my own argument. If the better team is defined as whichever side scores more goals across the rest of the tournament, then nothing identifies the better team in advance. Goals, expected goals, and entries all collapse toward the odds of a coin flip. The reason is circular: you are using goals to predict goals, and goals are the one thing that does not repeat from match to match. A definition of quality that makes quality unlearnable is a defective definition.
Test four: the coin flip
Define the stronger side as the one that consistently creates more danger across its other matches, and the question then becomes how much a single match tells you about which side that is.
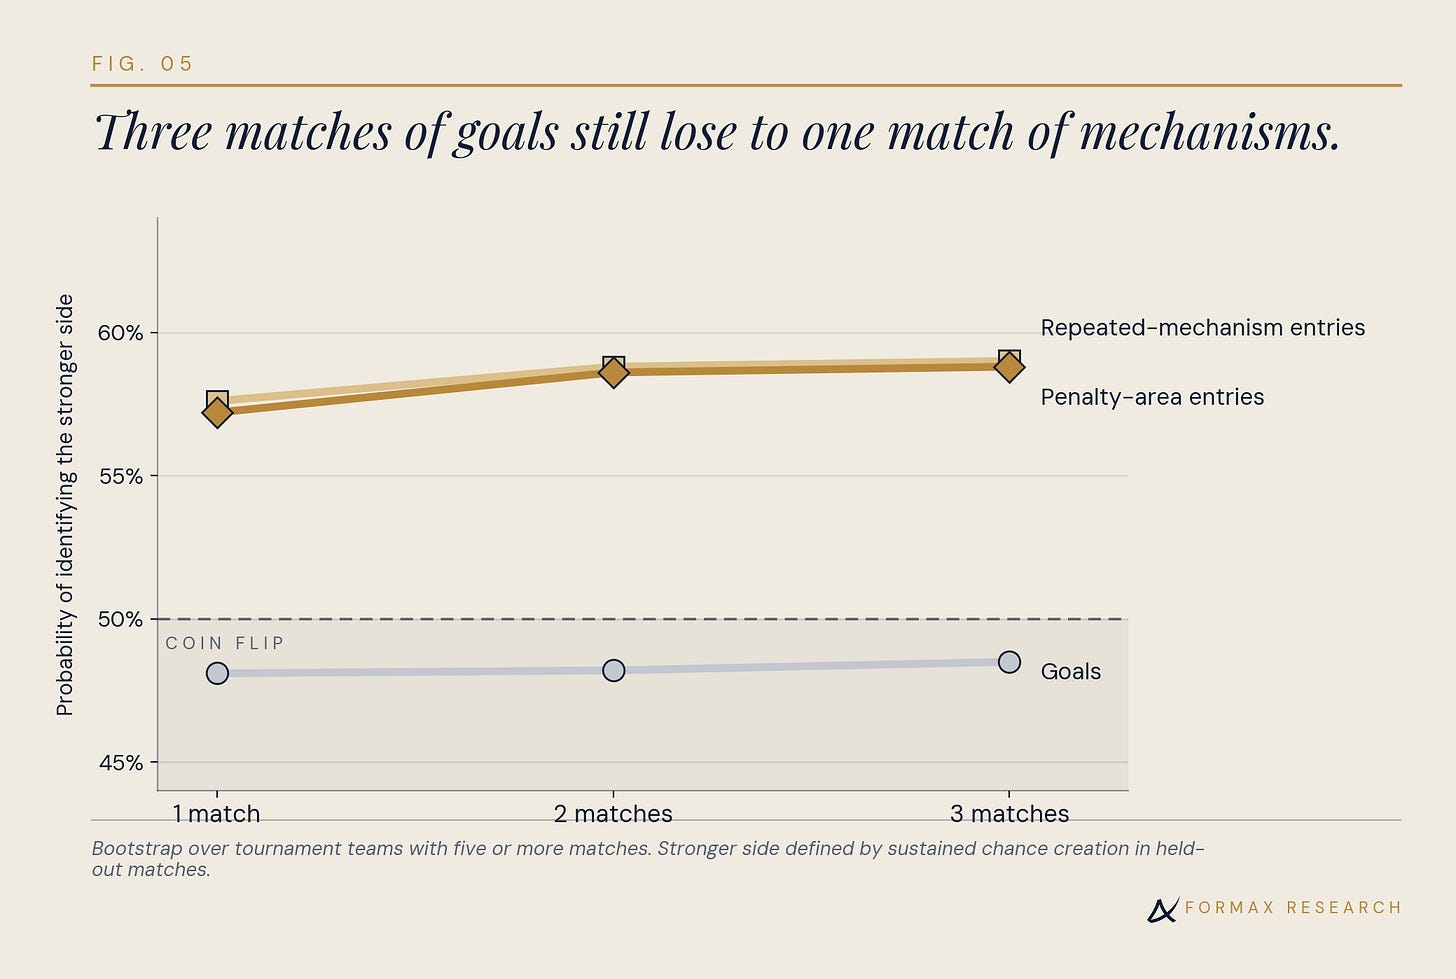 One match of goals identifies the stronger side 48.1% of the time, no better than a coin flip. Watch a second match and a third, and it barely improves, 48.2%, then 48.5%, because there is nothing in the goal column to accumulate: each match’s goals are a separate event, and in this sample, three matches of goals added almost nothing to one. Attacking production, however, behaves the opposite way. One match of penalty-area entries identifies the stronger side 57% of the time, three matches reach 59%, and the percentages keep climbing with every match you add. The evidence compounds because there is something real underneath to compound. A single match of counting arrivals tells you more than three matches of counting goals, and the gap only widens the longer you watch.
Is repetition real, or a by-product of volume?
Two team-matches from this sample make the distinction concrete before any stats are needed. France reached the penalty area 15 times in a match, doing so in 15 different ways; not a single mechanism was repeated. Germany reached the penalty area 26 times, and 22 of those arrivals came through repeated patterns used during the match. Both teams arrived, and arrival volume is itself evidence of production; however, only one of them arrived the same way twice. Arrivals answer how often a side gets there, and Recurrence answers how much of that was the same attack, repeated again.
A fair challenge to everything above: repeated-mechanism entries and total arrivals correlate at 0.905. They are very nearly the same number. If recurrence is only arrivals defined by a different label, this paper has proved something narrower than it set out to prove. Two questions hide inside that objection though, and they have different answers.
The first is whether teams repeat mechanisms more often than chance would produce. They do, and this is where the first law is established: identity is real, and countable. Take each team’s actual number of arrivals in a match, scatter them at random across the mechanism classes in the proportions the whole sample uses, and count the repeats that luck alone would deliver. The average team-match produces 7.72 repeated-mechanism entries. The random scatter produces 7.18. The excess is modest, about half an entry per match, but it is not a fluke of a few teams: most teams beat their own random scatter, 306 of 523 team-matches, and a gap this large across a sample this size would arise by luck less than 1 in 5,000,000 times. Teams return to the same origins, the same channels, and the same tempos more often than they would if their attacks were scattered the way the field as a whole attacks. That is what having an attacking identity means, stated as a number rather than an impression, and everything downstream depends on it: the scouting, the diagnosis, and the case for patience.
The second baseline is a harder test, and it makes the picture sharper. Build it from each team’s own repertoire instead, drawing every match’s entries from the mechanisms that team used across its other matches in the same tournament, and the expected repeat count rises to 9.2, because a team’s repertoire is far narrower than the field’s. Measured against their own habits, teams fall about 1.5 repeats short.
Read together, the two baselines bracket the answer. Teams repeat more than the field would by luck, so the identity is real. Teams repeat less than their own habits predict, so something is taking it away. That something is the opponent, who arrives at the match having studied the opponent and is therefore prepared to close some routes every match. This is the second law: the machine is real, and the opponent files it down, one match at a time.
The second question is whether that excess, the portion of repetition not explained by volume, behaves like a stable trait you could scout. The answer is simple: it doesn’t. Measured in the first half and again in the second, it correlates at −0.01, which is essentially nothing. Strip arrivals out of the recurrence count, and what remains predicts nothing about the next match either. The practical consequence is a division of labor between the two measures. Arrivals tell you how much machine a team has, and that number carries forward, which makes it the one to count if you are trying to judge a side or even track whether your own team is improving. It tells you nothing about what the machine looks like. The mechanism does that, and only that. Middle third, left half-space, four to nine passes, used eleven times, is a description you can take into your next session, because it names the thing to build or the thing to close down, but it should be understood that neither measure does the other’s job.
When you put those two answers together, the explanation is straightforward. The repetition is already inside the arrival count. No side reaches the penalty area twenty-one times in twenty-one different ways due to luck, because luck does not repeat on command, just like you cannot force a deflection or schedule a defensive error. Volume is itself proof of a machine, which is why arrivals and repeated mechanisms end up being nearly the same number, because, interestingly enough, they measure the same thing from opposite sides.
So the argument holds, and the measurement gets easier. What makes an attack good is whether the team can produce it again, not whether it went in, and you do not need the sixty-bin classification to count that. You need the arrivals, because a team that arrives 21 times has run its machine 21 times. The classification does not predict better; it describes better: which channel, which origin, which tempo, and therefore what a coach should build, protect, or take apart. That is the division of labor from earlier, and it’s why the classification earns its place here as diagnosis rather than forecast, whereas the scoreline of a match gives you neither.
Whose machine is it?
There is a question that the forward-looking tests do not address: whether a repeated attack is a better attack. At the level of the single arrival, yes. Entries belonging to a mechanism the team had already executed that match are worth 0.105 expected goals, compared to 0.067 for one-off arrivals, and they convert at 9.8% compared to 6.8%. Split by build length, though, that gap rests almost entirely in short sequences. That advantage is not spread evenly, though. Split the attacks by how they were built, and almost all of it sits in the short, direct ones. Among attacks of four passes or more, a repeated entry and a first-time entry are worth about the same.
That equality looks, at first, like a concession, but it is, in fact, the opposite. The comparison is being made one attack at a time, which is the wrong way to look at it because a mechanism never just appears once, and its value was never going to be visible in a single instance. Comparing one repetition against one improvisation is an instance comparison, and this paper exists to argue that instances are the wrong unit of comparison. If one repetition is worth as much as a single improvisation, then the mechanism a team can run five times is worth five improvisations, and no side can improvise on demand with opposition present and in the midst of contending play. The improvisation happened once, and nothing about it says it will happen again. The mechanism will still be there in the next match because the capability that produced it will remain.
The data on that point are not subtle, and they withstand the obvious objection. A mechanism class used once produces 0.067 expected goals across the match. Used twice, 0.136. Used three or four times, 0.283. Used five or more times, 2.325. Total value rising with use is trivially expected, since more entries produce more, so the number that matters is value per entry, and that rises as well: 0.067 for a mechanism class used once, 0.068 used twice, 0.088 used three or four times, and 0.391 for one used five or more. The association is superlinear rather than simply additive. Association is the deliberate word here, because an entry’s label depends on how often its mechanism class was used across the whole match, including uses that came after it, so the classification partly sees the future and cause cannot be separated from effect. The other caution is sample size: only 68 classes reach five uses, and those cluster in the situations discussed below.
The deeper claim is that repetition is evidence of a capability rather than a record of coincidence, and that is directly testable. A mechanism a team ran three or more times in a match reappears in its next match 59.9% of the time. Run the same question on the mechanisms a team used exactly once, and the number drops to 39.5%. That is a 52% higher return rate, and a gap that size across this many matches does not come from luck. The obvious objection is that heavily used mechanisms belong to teams that use them heavily everywhere, so the return would say more about the team’s habits than about the mechanism itself. So compare like with like: mechanism classes matched on how often the team used them across its other matches, and the advantage holds at 15 points in every group. Doing something once tells you it was available once. Doing it five times tells you it will very likely be there in the next match.
That is also the honest answer to anyone who watches a goal scored from a broken play and calls it quality. A single successful attempt and a reproducible process are not two grades of the same thing; they are different kinds of evidence, and it’s clear that only one of them predicts anything.
Here is the sharpest point in the argument: not every repeatable attack belongs to the team that produced it. An attack built from a high turnover needs the opponent to make a mistake in a particular place, and a competent opponent can stop making it. An attack built from the team’s own half requires its players to execute under pressure, a feature grounded in individual and team sovereignty. The numbers separate the two cleanly. Long-build arrivals predict the same team’s arrivals in its next match at 0.341. Short-build arrivals are predicted at 0.098, which is close to zero. Counterattacks, the purest borrowed attack in the classification, tell you nothing at all about the next match: -0.05. Inside a single match, stability runs the same way: 0.294 from first half to second for long builds, 0.184 for mid, 0.136 for short.
The timing gives the dependency away. If direct attacks need the match and the opponent to supply their conditions, they should pile up wherever those conditions occur, and they do. The last fifteen minutes of a match produce 29.9% of all short-build arrivals, nearly a third of them from one sixth of the clock, because that is when losing teams abandon their structure and chase, and the gaps and turnovers a direct attack feeds on are suddenly everywhere. Long-build arrivals, on the other hand, keep no schedule at all. Across the six fifteen-minute blocks of a match, they range from 13.8% to 21.7%, roughly even from first whistle to last, because the only condition a constructed attack needs is the players’ capability, and that is present in every minute. The halves say the same thing: long-build volume barely moves from first half to second, down 2.5%, while short-build volume rises 18.7% as matches loosen. One machine runs on its own power at any point in a match. The other waits for the game to break open, and in a match that never breaks open, that production never arrives.
This is the recurrent and transient distinction from the beginning of the paper, now supported by evidence. To be precise about the press: the pressing action can be entirely a team’s, coordinated and trained. The error it produces is jointly manufactured, and the opponent can withdraw their half of it by clearing earlier, playing longer, and refusing to circulate near their own box. The high-turnover attack is more valuable per instance and far weaker as a plan because it relies on revenue from a supplier who can change the terms without notice, so to speak. The constructed attack converts each arrival at a lower rate and is substantially more persistent across matches, which, over a season, compounds. Reproducibility, properly understood, means self-generated. An attack that depends on the opponent’s error was never yours to reproduce, however skillfully you invited it.
The fingerprint
None of this suggests that strong teams do not score. Goals still matter, and strong teams still score them. The machine comes first; the goals come from it, and only the machine says anything about the production in matches still to come. Count how often a team arrives, and you are looking at its future production. The scoreline only tells you about the match it came from.
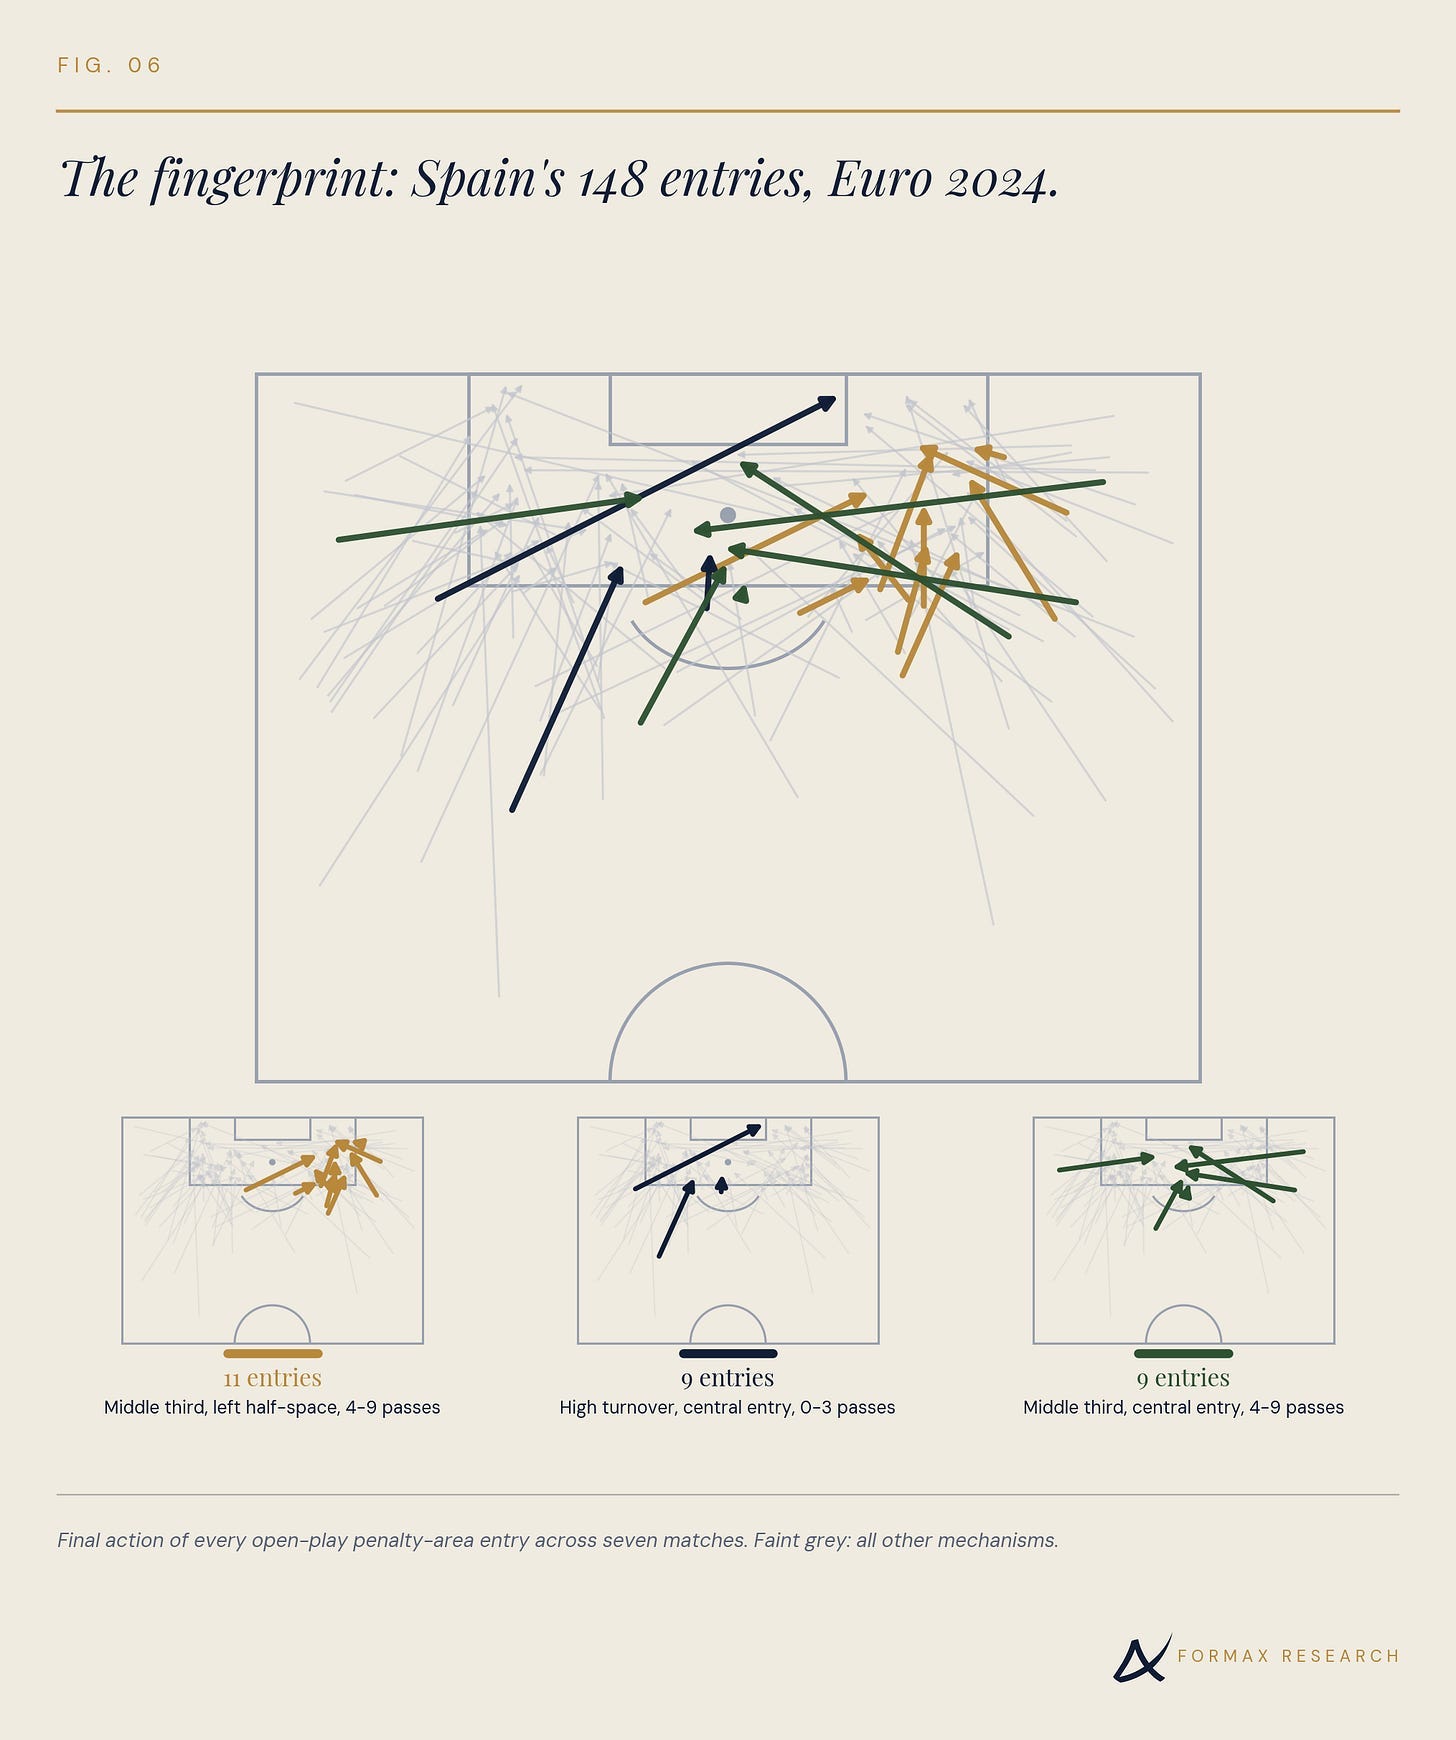 Spain at Euro 2024 won all seven matches and produced 148 open-play entries into the penalty area, 21 per match against a field average of 15. Their repeated-mechanism entries ran at 12 per match against 7.4 for the rest of the tournament, more than 60% more recurrence than the field they beat. Three mechanism classes account for most of the signature. The largest is not central at all but the left half-space, entered from the middle third through four to nine passes, exactly the lane positional play treats as the key to unlocking a set defense. The other two are central, one a patient central entry and one a quick strike from a high turnover. Two group matches would have been enough to identify the eventual champion from that pattern. The goal column would not have told you, because it recorded 3-0, 1-0 and 1-0, and one-goal margins read as fragility. The mechanisms, however, said the opposite, and the same mechanisms were still available in the final, where they produced two more goals. One clarification before going further: the signature is a tournament-wide pattern, not a weekly one. Add up all seven matches and three classes dominate. Take the matches one at a time and none of the three was a constant; no class repeated in more than three of the seven. Spain did not carry a fixed route from match to match. They carried habits broad enough that the same three kept surfacing across a tournament, and the paper returns to what that difference means below.
The obvious objection
Anyone who followed the 2026 World Cup will remember the final, where Spain not only beat Argentina, but comprehensively outplayed Argentina. If Argentina’s machine was the real story in Doha, why did it not hold four years later?
Begin with what that match actually contained, because the scoreboard read 1-0 and the machine read nothing remotely close to that. Spain took 20 shots, 12 on target, for 1.94 expected goals. Argentina took two shots, none on target, worth 0.20, and did not attempt one until the 117th minute. Argentina became the first side on record to play 90 minutes of a World Cup final without a single attempt at goal. Enzo Fernández was sent off in the third minute of stoppage time at the end of 90 minutes, so the shotless period was eleven against eleven and cannot be explained by the red card.
Now consider what the scoreboard was reporting while that was going on. For 105 minutes it read 0-0, which is the reading for a contest between equals. Emiliano Martínez made 11 saves, more than any goalkeeper has made in a World Cup final. The scoreboard was wrong about that match for almost its entire duration and became right only in the 106th minute, when Ferran Torres converted Spain’s 20th shot. Had Torres missed, the match might well have reached penalties with the scoreboard still insisting the two sides were level, and a shootout would have been recorded as a coin flip between a team that had generated 20 chances and a team that had generated two.
As for why Argentina’s machine did not hold, nothing in this paper claims that a machine is permanent. It is built by a particular staff with a particular squad across a cycle, and it decays as personnel, age profile, and ideas change. Four years is long enough to build one or to lose one, and Argentina’s route to that final showed the decay in advance to anyone who was counting. Throughout the tournament, they created chances worth 14.78 expected goals and scored 19, while conceding chances worth 4.06 expected goals and allowing 8. They were beating their own process on the offensive end and losing to it on the defensive end for seven consecutive matches. Finishing overperformance on that scale is the least persistent quantity in the sport. Spain arrived at the same final having created 13.61 and scored 13, having conceded 2.18 and allowed 2. Process and outcome matched at both ends; they were stable, consistent, and predictable.
I published Spain at 63.2% to lift the trophy before kickoff, above the market and above Opta’s 59.6%, and that number came from chances created and conceded rather than from results. The confidence behind it came from the argument this paper makes.
One longer point is worth stating carefully. The Spain fingerprint measured in this paper comes from Euro 2024, two years before that final. Spain’s attacking production and broader identity remained visible two years later, and a machine measured in one tournament preceded a trophy in the next, which is what reproducibility looks like once it is extended from 90 minutes to a cycle. Whether the same three coded mechanisms persisted at the measured rate is a hypothesis, not yet a finding, until the event data exists to test it.
A limitation to be clear about. The figures above are public match data, shots and expected goals, not my own event-level classification, because StatsBomb has not released open event data for that tournament. When it is released, I will run the same recurrence measurement on that final and publish the result whichever way it falls.
At the senior level, the scoreboard is a weak measure of attacking quality. What matters is whether the attack can be run again.
Part 2 takes that claim to a Saturday morning.
*Data: StatsBomb open event data, 262 matches, FIFA World Cup 2018 and 2022, UEFA Euro 2020 and 2024, Copa América 2024, yielding 7,923 open-play penalty-area entries.
Route consistency is measured over team tournaments with five or more matches (n = 36) as the share of matches in which the team’s most frequently repeated mechanism class recurred.
Attacks defined as open-play possessions producing a completed pass into the penalty area, a carry into the penalty area, or a shot.
Mechanism classes: possession origin third by entry channel by build-length bucket, counterattacks flagged.
Entry channel uses five lanes (left wing, left half-space, center, right half-space, right wing) with boundaries at the penalty-area and six-yard-box edges.
Recurrence rate reported throughout as repeated-mechanism entries per match; the proportion of entries falling in repeated classes is reported separately where relevant and is the weaker of the two measures.
Correlations are Pearson; identification curves are bootstrap estimates over tournament teams with five or more matches, with the stronger side defined by mean expected goals across held-out matches, averaged across three seeds.
Rest-defense figures compare each team against itself across 20,151 attacking-half possessions, restricted to the 38 teams with at least 25 possessions in both the short-build and long-build categories.
Limitations: repeated-mechanism volume and total arrivals correlate at 0.905. Teams do repeat mechanisms above a random-assignment baseline (7.72 against 7.18 entries per match, Wilcoxon p < 2e-07), but the excess over chance does not persist between halves (r = -0.01), and the residual of recurrence once arrivals are removed carries no measurable forward predictive content; mechanism classification is therefore reported as diagnostic rather than as an independent predictor. The entry dataset contains completed penalty-area entries only, so attempts that broke down are absent. Any inference from recurrence to individual capability is therefore conditioned on success and should be read as evidence of a sufficient technical base rather than as a measurement of individual technical level.
Recurrence as defined here is a team-level quantity and carries no information about individual technical execution, perceptual speed, or transfer across positions and systems.
Durability figures compare arrivals by build-length bucket across consecutive matches within a tournament (396 pairs) and between halves of the same match.
Mechanism persistence compares the reappearance rate in a team’s next match for classes used three or more times (n = 347) against classes used exactly once (n = 2,941); the advantage survives stratification on the team’s usage of the class in its other matches (matched difference +15 points).
Two null models are reported for within-match repetition: random assignment from the field-wide mechanism distribution (observed 7.72 vs 7.18, p < 2e-7) and a leave-one-match-out draw from the team’s own tournament repertoire (expected 9.2, observed 1.5 repeats below, p < 1e-30), so within-match repetition reflects stable team identity suppressed by the specific opponent rather than within-match clustering beyond style.
Compounding classifies an entry by its class’s full-match frequency and therefore partly conditions on later events; it is reported as association.
The identification test defines the stronger side by held-out expected goals, which favors chance-production measures by construction; goals were separately tested against a goals-defined target in Test three, where all measures collapse.
Identification curves average three seeds with ranges within about one point.
Match state bends second halves, tournament samples are short, and elite international football is not a youth league. Each of those confounds also afflicts the goal count more severely.*