Every possession in football ends. The ball is shot, kicked out of play, or taken by the other team, and everything between the first touch and that ending is a run of moves from one situation to the next. Markov chains in football write that run down precisely. They belong to the wider class of stochastic processes, sequences of events in which each step occurs with a probability instead of with certainty.
This paper uses that mathematics to set out what Forms Academy believes about youth development. A young player’s technique sets the odds of each step in a possession, those odds multiply, and the product becomes visible only over many repetitions.
What Markov chains in football actually model
A Markov chain is a stochastic process in which the probability of the next state depends only on the present one:
In a football model, the transient states are situations in possession, the p_ij form a transition matrix whose rows sum to one, and the absorbing states are the ways a possession ends: a goal or shot, a dead ball, a turnover. Sarah Rudd’s 2011 presentation at the New England Symposium on Statistics in Sports used 39 states with two absorbing ones.
Karun Singh’s Expected Threat (xT), published in 2019, divides the pitch into 192 zones and defines each zone’s value through the zones that follow it:
Here, s_z is the probability of shooting, g_z the probability of scoring given a shot, m_z the probability of moving the ball, and T the matrix of destinations. This is a Bellman equation (Bellman, 1957) in its policy evaluation form, with the league’s average behaviour as the policy. Singh solved it by value iteration. Kemeny and Snell’s (1960) treatment of absorbing chains gives the same object in closed form. With Q the matrix of transitions between transient states, the fundamental matrix
has entries n_ij equal to the expected number of visits to state j by a possession starting in state i, and its row sums give the expected number of steps before absorption, which is possession length.
Stochastic processes in football: chance, rare goals and the patience compounding requires
Goals are rare events. Maher (1982) showed that English league scores are described reasonably well by treating each team’s goals as Poisson, with its own attacking and defensive strength:
where lambda is the expected number of goals. Dixon and Coles (1997) refined it with a correction for low scores. A score, in these models, is one draw from a distribution with a knowable average and a wide spread.
Researchers have also tried to measure how often chance is involved in goals. Lames (2018) examined 1,931 goals from the 2011/12 Bundesliga and Premier League seasons and found that 47.0% involved at least one chance factor, such as a deflection, rebound or defensive error. Wunderlich, Seck and Memmert (2021) checked 7,263 Premier League goals from 2012/13 to 2018/19 and found some random influence in about 46%, more often for weaker teams. These figures count chance involvement in goals, a narrower quantity than the share of a result owed to luck.
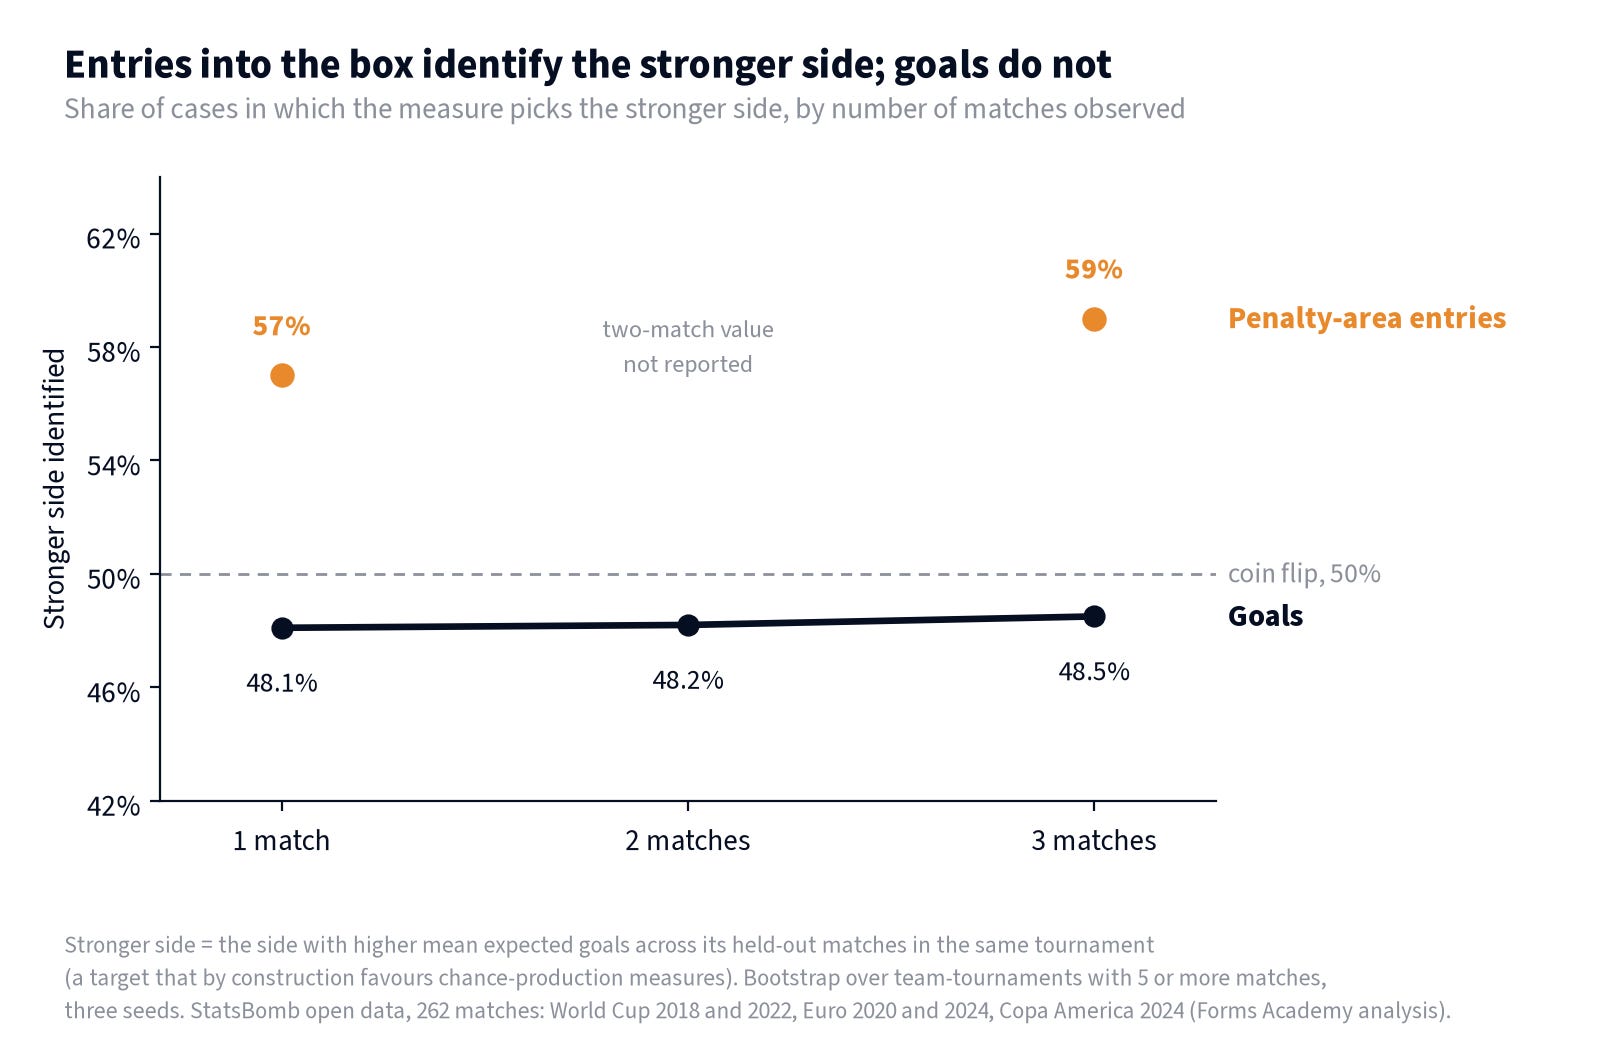
The consequence is that a better underlying process needs many repetitions before it shows up reliably in results. In a constructed illustration, suppose one team averages 1.2 goals per match and another 1.0, a 20% edge. Treating goals as Poisson, the better team wins a single meeting 40.6% of the time, and in simulated head-to-head series it finishes ahead on points only 58.1% of the time after ten matches and 74.7% after forty (Figure 1). Monte Carlo simulation, used for those series, returns the whole distribution of outcomes instead of an average. Tournament data show the same pattern: across 262 matches, goals picked the stronger side less than half the time even over three matches, while penalty-area entries reached 59% (The Recurrence Rate, 2026; Figure 2). A season of results is too short to reveal a real but modest improvement in a youth team. That is why patience in development is a mathematical requirement: a process that compounds pays out in the long run, and the short run is where it looks most like losing.
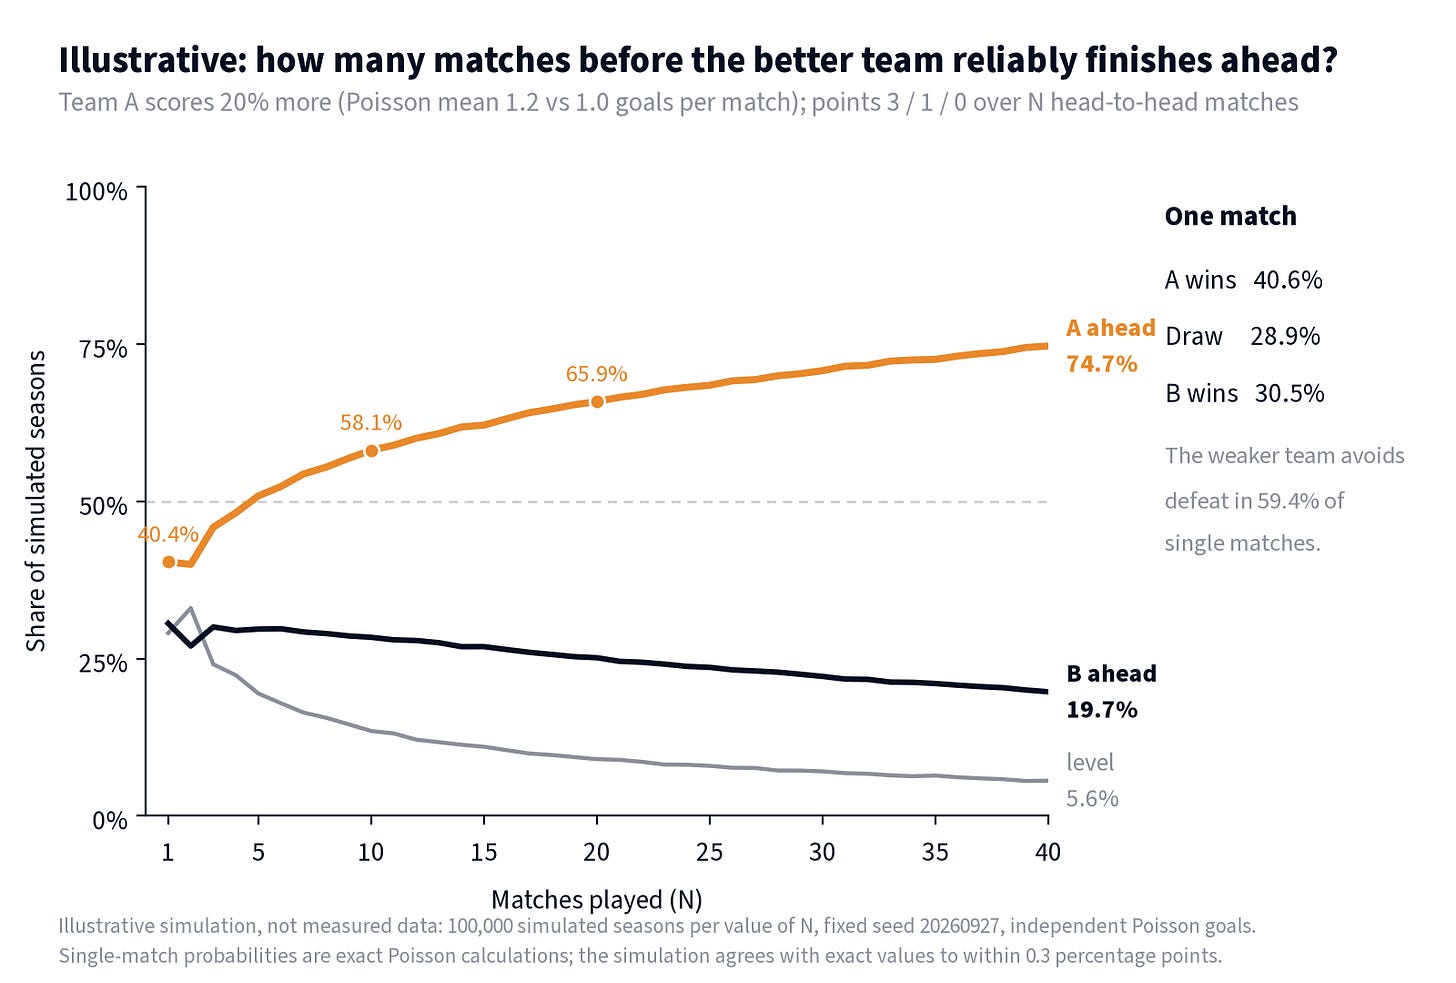
- Figure 1: Illustrative: how many matches before the better team reliably finishes ahead? Team A scores 20% more than Team B (independent Poisson goals, means 1.2 and 1.0 per match); in one match A wins 40.6%, draws 28.9%, and loses 30.5%, and over N head-to-head matches scored 3 / 1 / 0, A finishes strictly ahead on points in 40.4% of simulated seasons after 1 match, 58.1% after 10, 65.9% after 20 and 74.7% after 40. Source: Monte Carlo simulation, 100,000 simulated seasons per value of N (N = 1 to 40), fixed seed 20260927; single-match probabilities are exact Poisson calculations, and simulated values agree with exact calculations to within 0.3 percentage points. Not measured data.Figure 2: Entries into the box identify the stronger side; goals do not. Share of cases in which one, two or three matches of a measure pick the stronger side, defined as the side with higher mean expected goals across its held-out matches in the same tournament: goals stay below a coin flip (48.1, 48.2, 48.5%), while penalty-area entries reach 57% after one match and 59% after three (the two-match value for entries is not reported). The expected-goals target favours chance-production measures by construction, a limitation stated in the original analysis. Source: StatsBomb open event data, 262 matches (FIFA World Cup 2018 and 2022, UEFA Euro 2020 and 2024, Copa America 2024); bootstrap over team-tournaments with five or more matches, averaged across three seeds. Forms Academy analysis (”The Recurrence Rate”, Test four).
What 18,803 tournament possessions show
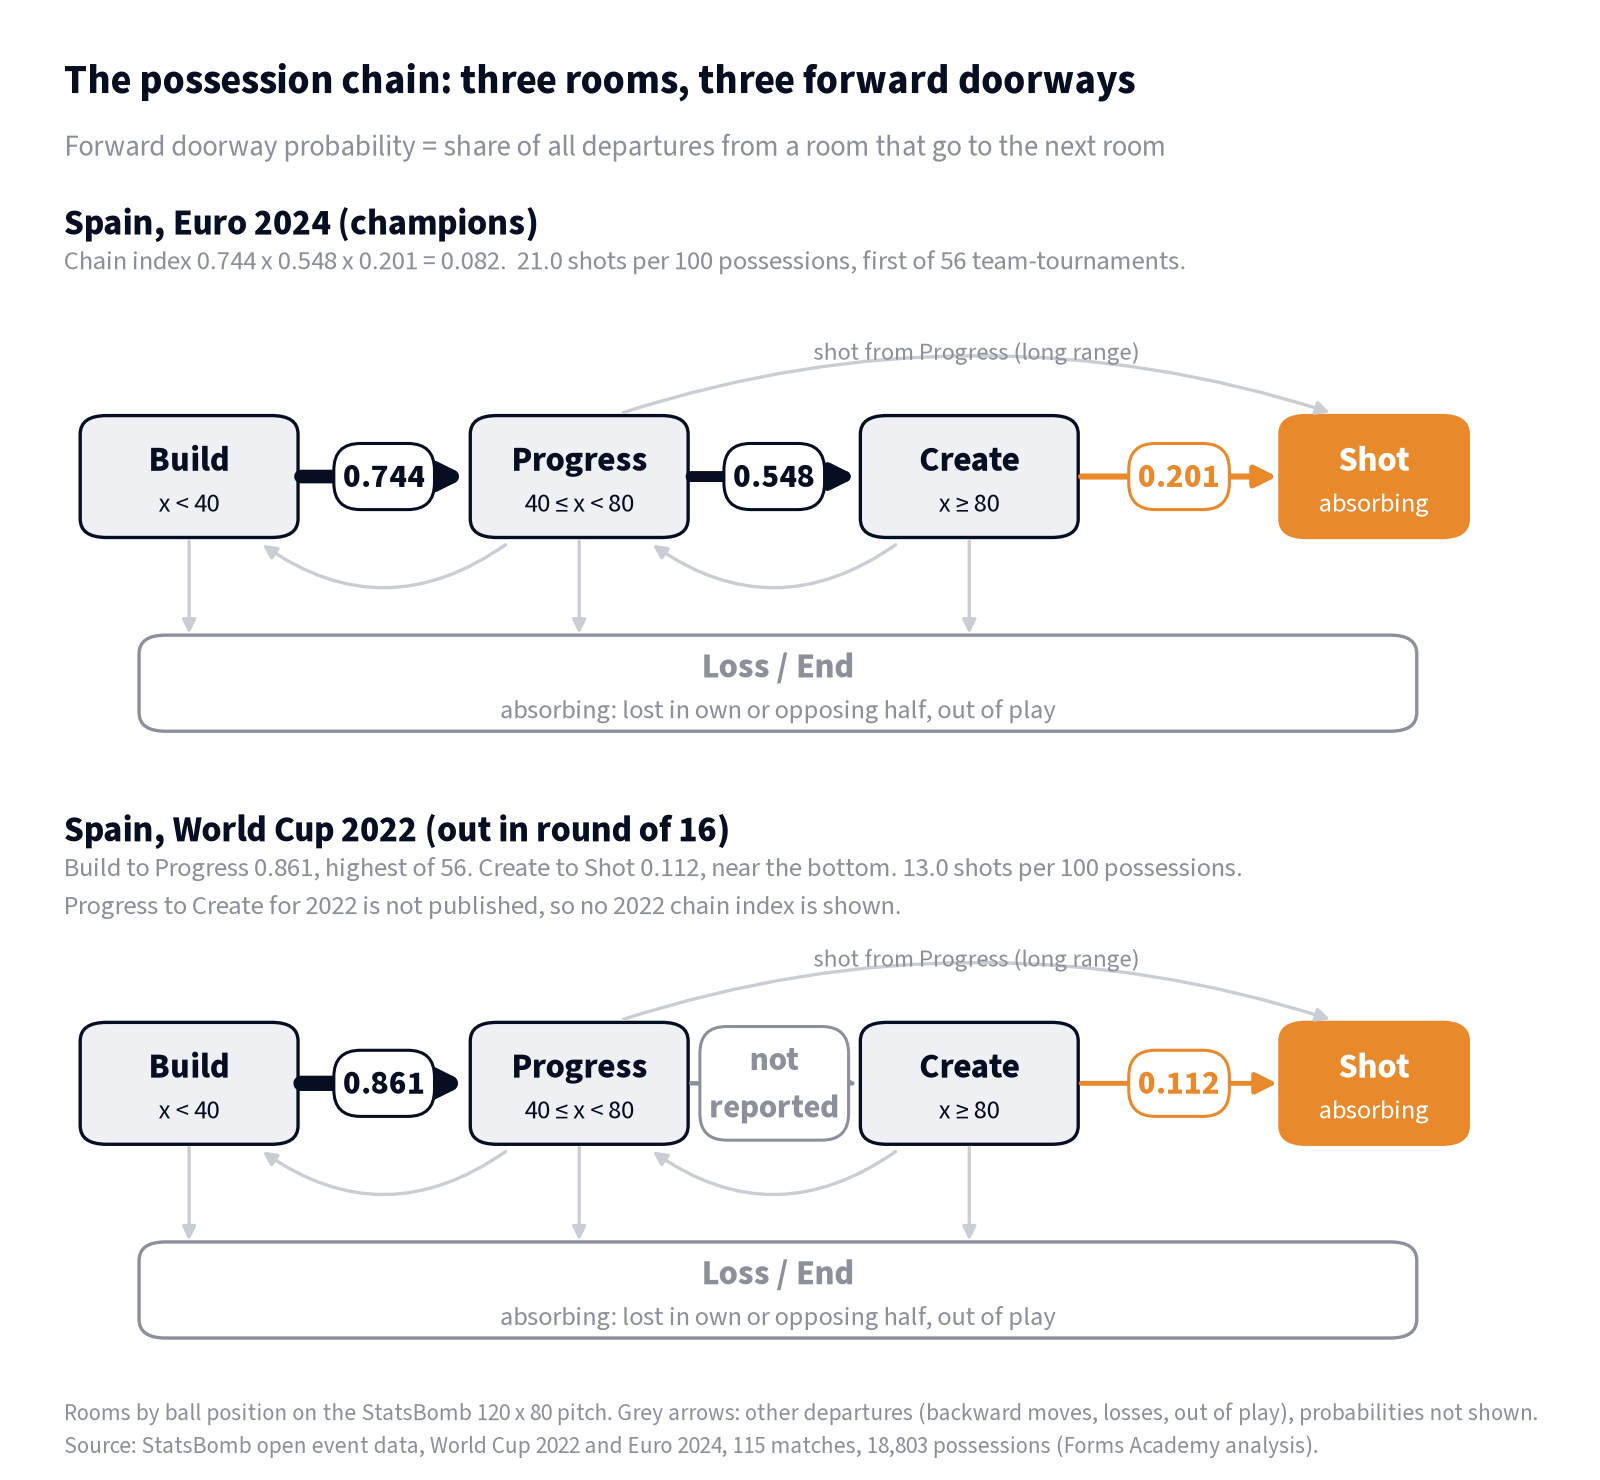
FORMAX Research fitted a simple chain to StatsBomb open data from the 2022 World Cup and Euro 2024: 115 matches, 18,803 possessions, 2,525 shots and 56 team-tournaments (The Arrival Rate, 2026). The pitch was split into three rooms, Build, Progress and Create, joined by doorways (Figure 3). The product of the three doorway probabilities, called the chain index, correlated with expected goals per possession at r = 0.705. Entry into the final third was the strongest single doorway, at r = 0.636.Teams in the top quarter of the chain index produced 0.0197 expected goals per possession against 0.0100 in the bottom quarter, and 17.8 shots per 100 possessions against 9.0, both ratios of 1.98. The quality of their shots barely differed (0.111 against 0.107 expected goals per shot). The better chains won on how often they arrived, which is a transition probability.*Figure 3: The possession chain: three rooms, three forward doorways. Each possession moves through Build (x Markov chains in football describe the game as a sequence of states with odds attached, and the wider theory of stochastic processes shows why those odds reach the scoreboard slowly and unevenly. The odds that matter most belong to individual players, multiply across a possession, and can be changed by coaching. Raising them one player at a time, in designed formats that give each child the most varied repetitions, sequenced by capacity as the Forms Methodology prescribes, is the approach whose results arrive late and compound for years.
References
- Ashworth, J. and Heyndels, B. (2007). Selection bias and peer effects in team sports: The effect of age grouping on earnings of German soccer players. Journal of Sports Economics, 8(4), 355 to 377.
- Bellman, R. (1957). Dynamic Programming. Princeton University Press.
- Capranica, L., Tessitore, A., Guidetti, L. and Figura, F. (2001). Heart rate and match analysis in pre-pubescent soccer players. Journal of Sports Sciences, 19(6), 379 to 384.
- Cervone, D., D’Amour, A., Bornn, L. and Goldsberry, K. (2016). A multiresolution stochastic process model for predicting basketball possession outcomes. Journal of the American Statistical Association, 111(514), 585 to 599.
- Clarke, A. R., Barry, R. J., McCarthy, R. and Selikowitz, M. (2001). Age and sex effects in the EEG: Development of the normal child. Clinical Neurophysiology, 112(5), 806 to 814.
- Cobley, S., Baker, J., Wattie, N. and McKenna, J. (2009). Annual age-grouping and athlete development: A meta-analytical review of relative age effects in sport. Sports Medicine, 39(3), 235 to 256.
- Cumming, S. P., Lloyd, R. S., Oliver, J. L., Eisenmann, J. C. and Malina, R. M. (2017). Bio-banding in sport: Applications to competition, talent identification, and strength and conditioning of youth athletes. Strength and Conditioning Journal, 39(2), 34 to 47.
- Decroos, T., Bransen, L., Van Haaren, J. and Davis, J. (2019). Actions speak louder than goals: Valuing player actions in soccer. Proceedings of the 25th ACM SIGKDD International Conference on Knowledge Discovery and Data Mining, 1851 to 1861.
- Dixon, M. J. and Coles, S. G. (1997). Modelling association football scores and inefficiencies in the football betting market. Journal of the Royal Statistical Society, Series C (Applied Statistics), 46(2), 265 to 280.
- Fenoglio, R. (2003). The Manchester United 4 v 4 pilot scheme for U9s, Part I, Insight: The FA Coaches Association Journal, Summer 2003; and Part II, The analysis, Insight (later cited as vol. 6, 21 to 24, 2004).
- FORMAX Research (2026). Beating a Man Is the Most Valuable Action in Football. https://ronhogsett.substack.com/p/beating-a-man-is-the-most-valuable
- FORMAX Research (2026). Constraint-Based Learning in Football: How Task Design Builds Technical Players Who Can Think. https://ronhogsett.substack.com/p/constraint-based-learning-in-football
- FORMAX Research (2026). The Ladder. https://ronhogsett.substack.com/p/the-ladder
- FORMAX Research (2026). The Arrival Rate. https://ronhogsett.substack.com/p/the-arrival-rate
- FORMAX Research (2026). The Recurrence Rate. https://ronhogsett.substack.com/p/the-recurrence-rate
- Gogtay, N., Giedd, J. N., Lusk, L., Hayashi, K. M., Greenstein, D., Vaituzis, A. C., et al. (2004). Dynamic mapping of human cortical development during childhood through early adulthood. Proceedings of the National Academy of Sciences, 101(21), 8174 to 8179.
- Helsen, W. F., Van Winckel, J. and Williams, A. M. (2005). The relative age effect in youth soccer across Europe. Journal of Sports Sciences, 23(6), 629 to 636.
- Hill, M., Scott, S., Malina, R. M., McGee, D. and Cumming, S. P. (2020). Relative age and maturation selection biases in academy football. Journal of Sports Sciences, 38(11 to 12), 1359 to 1367.
- Jones, S. and Drust, B. (2007). Physiological and technical demands of 4 v 4 and 8 v 8 games in elite youth soccer players. Kinesiology, 39(2), 150 to 156.
- Katis, A. and Kellis, E. (2009). Effects of small-sided games on physical conditioning and performance in young soccer players. Journal of Sports Science and Medicine, 8(3), 374 to 380.
- Kemeny, J. G. and Snell, J. L. (1960). Finite Markov Chains. Van Nostrand.
- Lames, M. (2018). Chance involvement in goal scoring in football: An empirical approach. German Journal of Exercise and Sport Research, 48(2), 278 to 286.
- Le Coz, S., Boustila, F. and Imbach, F. (2026). A semi-Markov framework for modeling football possessions and temporal expected threat. Scientific Reports. https://doi.org/10.1038/s41598-026-52938-1
- Luna, B., Garver, K. E., Urban, T. A., Lazar, N. A. and Sweeney, J. A. (2004). Maturation of cognitive processes from late childhood to adulthood. Child Development, 75(5), 1357 to 1372.
- Maher, M. J. (1982). Modelling association football scores. Statistica Neerlandica, 36(3), 109 to 118.
- Rudd, S. (2011). A framework for tactical analysis and individual offensive production assessment in soccer using Markov chains. New England Symposium on Statistics in Sports. https://nessis.org/nessis11/rudd.pdf
- Singh, K. (2019). Introducing Expected Threat (xT). https://karun.in/blog/expected-threat.html
- StatsBomb (2026). StatsBomb Open Data: FIFA World Cup 2022 and UEFA Euro 2024 event data. https://github.com/hudl/open-data (accessed 27 September 2026).
- U.S. Soccer (2017). Player Development Initiatives: Small-sided standards. U.S. Soccer Federation.
- Wunderlich, F., Seck, A. and Memmert, D. (2021). The influence of randomness on goals in football decreases over time: An empirical analysis of randomness involved in goal scoring in the English Premier League. Journal of Sports Sciences, 39(20), 2322 to 2337.
Ron Hogsett is the founder of Forms Academy and architect of the Forms Methodology, a neuroscience-driven framework for youth football development focused on technical mastery, cognitive speed, and motor efficiency.
The Forms Methodology and the FORMAX 5x5 framework are set out in more detail at FormsAcademy.com.